Donate to Remove ads

Got a credit card? use our Credit Card & Finance Calculators

Thanks to eyeball08,Wondergirly,bofh,johnstevens77,Bhoddhisatva, for Donating to support the site

TJH Portfolio adjustment

For discussion of the practicalities of setting up and operating income-portfolios which follow the HYP Group Guidelines. READ Guidelines before posting
Forum rules
Tight HYP discussions only please - OT please discuss in strategies
Arborbridge
The full Lemon
Posts: 10439
Joined: November 4th, 2016, 9:33 am
Has thanked: 3640 times
Been thanked: 5272 times

Re: TJH Portfolio adjustment

#342576

Postby Arborbridge » September 24th, 2020, 5:12 pm

Wizard wrote:
tjh290633 wrote:
Arborbridge wrote:I have occasionally - as now - had UU. bubbling under on my radar and might well be in the mix this month. However, I've always been put off by the cash flow: does that not come into your reckoning, Terry?

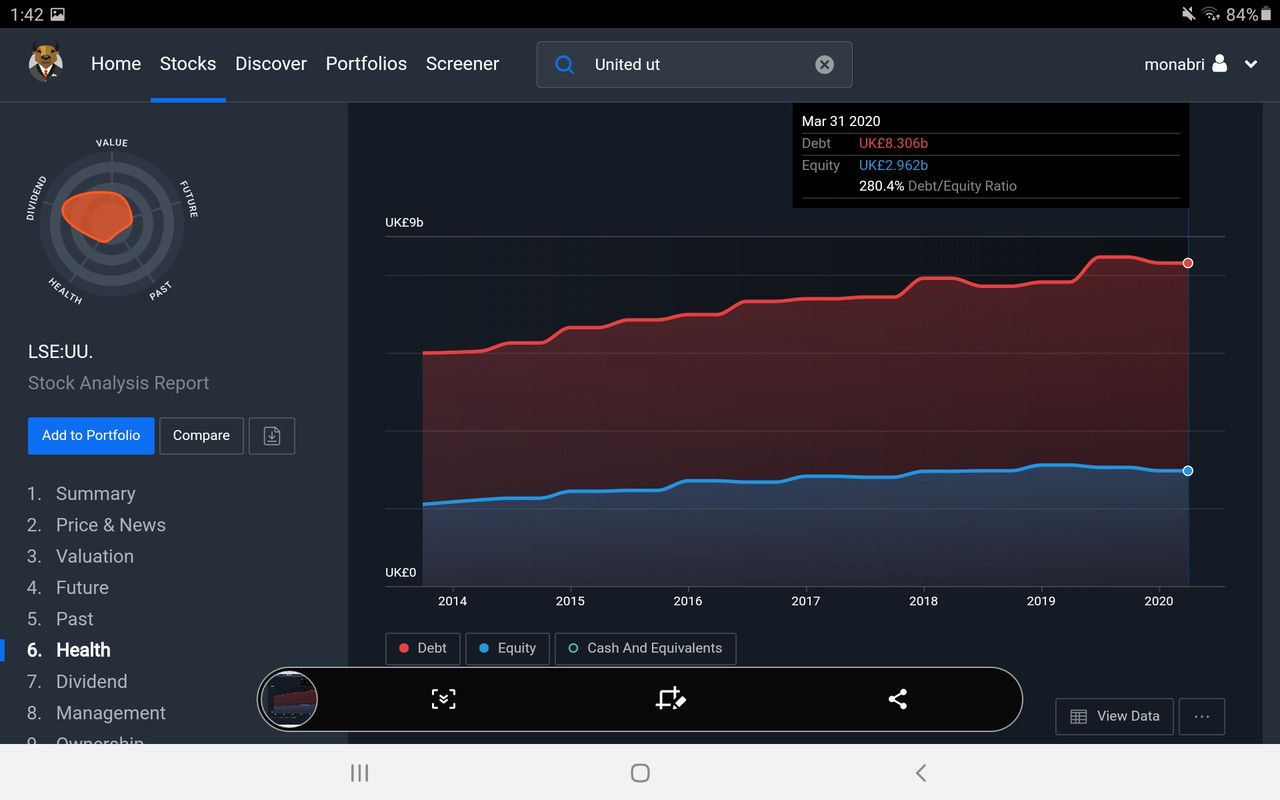
If the numbers below are correcthe dividend hasn't been covered by free cash at all recently. This cannot go on for ever, or these numbers are misleading in a big way. Much cash is being spent on CAPEX, but whether that will lead to a big return to compensate, or is just an occupational hazard (money down the drain!) in keeping the pipes going, is a moot point

I would like some insight into this, because we are often told that free cash is critical. It's a similar story for SSE.


Arb.

I'm puzzled by your figures, Arb. https://www.investegate.co.uk/united-ut ... 00086888N/ shows that for the year to 31 Mar 2020 the Net cash flow was £810m and the cost of dividends was £284m. The previous year the Net Cash Flow was £832m, and the cost of Dividends was £274m.

That looks covered to me.

TJH


You are confusing cash generated from operations with net cash flow, I suggest you re-read your link...

Net cash generated from continuing operating activities for the year ended 31 March 2019 was £810 million, and therefore broadly consistent with £832 million in the previous year. The group's net capital expenditure was £645 million, principally in the regulated water and wastewater investment programmes. This excludes infrastructure renewals expenditure which is treated as an operating cost under IFRS. Cash flow capex differs from regulatory capex, since regulatory capex includes infrastructure renewals expenditure and is based on capital work done in the period, rather than actual cash spent.


So would you like to give your view on what the free cash flow cover is, please?

The way I've done it from morningstar - taking the cash flow per share, then subtracting the CAPEX usually seemed to agree with Company REFS - back in the day when I was a subscriber. The uncertainty, is whether maintenance capex screws up the result, but taking the whole CAPEX would surely be on the safe side.

Wizard
Lemon Quarter
Posts: 2829
Joined: November 7th, 2016, 8:22 am
Has thanked: 68 times
Been thanked: 1029 times

Re: TJH Portfolio adjustment

#342581

Postby Wizard » September 24th, 2020, 5:25 pm

Arborbridge wrote:
Wizard wrote:
tjh290633 wrote:I'm puzzled by your figures, Arb. https://www.investegate.co.uk/united-ut ... 00086888N/ shows that for the year to 31 Mar 2020 the Net cash flow was £810m and the cost of dividends was £284m. The previous year the Net Cash Flow was £832m, and the cost of Dividends was £274m.

That looks covered to me.

TJH


You are confusing cash generated from operations with net cash flow, I suggest you re-read your link...

Net cash generated from continuing operating activities for the year ended 31 March 2019 was £810 million, and therefore broadly consistent with £832 million in the previous year. The group's net capital expenditure was £645 million, principally in the regulated water and wastewater investment programmes. This excludes infrastructure renewals expenditure which is treated as an operating cost under IFRS. Cash flow capex differs from regulatory capex, since regulatory capex includes infrastructure renewals expenditure and is based on capital work done in the period, rather than actual cash spent.


So would you like to give your view on what the free cash flow cover is, please?

The way I've done it from morningstar - taking the cash flow per share, then subtracting the CAPEX usually seemed to agree with Company REFS - back in the day when I was a subscriber. The uncertainty, is whether maintenance capex screws up the result, but taking the whole CAPEX would surely be on the safe side.

Assuming there is nothing they have not mentioned in the paragraph I would say cash generated minus capital expenditure is a decent number. That ties to your initial point that the dividend is uncovered by free cash flow. But, the main point I was hoping to make is a warning to people not to invest in UU. on the basis of TJH's complete misunderstanding of what is actually I think a pretty clear paragraph.

As to your point on money going down the drain, note the exclusion of renewals from capital expenditure, I don't follow UU. but my conclusion is therefore that capital expenditure is not (as shown in the link) about mending leaking pipes.

tjh290633
Lemon Half
Posts: 8266
Joined: November 4th, 2016, 11:20 am
Has thanked: 918 times
Been thanked: 4130 times

Re: TJH Portfolio adjustment

#342588

Postby tjh290633 » September 24th, 2020, 5:55 pm

Arborbridge wrote:
I will recheck - the figures came from morningstar. I don't think net cash is the same as free cash. From the net, wouldn't one need to subtract the CAPEX? Depends how they are defining "net".

Look at the Cash Flow statement.

There was an increase in cash at the end of the year in 2020 of £188.6m, compared with a decrease of (£172.8m) in 2019.

If there was an increase, then there has to have been a surplus of cash.

TJH

Wizard
Lemon Quarter
Posts: 2829
Joined: November 7th, 2016, 8:22 am
Has thanked: 68 times
Been thanked: 1029 times

Re: TJH Portfolio adjustment

#342603

Postby Wizard » September 24th, 2020, 7:32 pm

tjh290633 wrote:
Arborbridge wrote:
I will recheck - the figures came from morningstar. I don't think net cash is the same as free cash. From the net, wouldn't one need to subtract the CAPEX? Depends how they are defining "net".

Look at the Cash Flow statement.

There was an increase in cash at the end of the year in 2020 of £188.6m, compared with a decrease of (£172.8m) in 2019.

If there was an increase, then there has to have been a surplus of cash.

TJH

Having looked at that cashflow statement I see that they did indeed leave a number of chunky figures out of the paragraph where you sourced the numbers you first quoted. Amongst other things the fact they took out new debt of £805.4m while only repaying old debt of £545.9m, so new borrowings contributed roughly £260m of additional cash. Broadly speaking then they increased their borrowing in order to pay almost all of the £285m of dividend payment.

I still believe Arb's initial point is correct, the business did not generate the cash to pay the dividend.

tjh290633
Lemon Half
Posts: 8266
Joined: November 4th, 2016, 11:20 am
Has thanked: 918 times
Been thanked: 4130 times

Re: TJH Portfolio adjustment

#342645

Postby tjh290633 » September 24th, 2020, 10:55 pm

Wizard wrote:Having looked at that cashflow statement I see that they did indeed leave a number of chunky figures out of the paragraph where you sourced the numbers you first quoted. Amongst other things the fact they took out new debt of £805.4m while only repaying old debt of £545.9m, so new borrowings contributed roughly £260m of additional cash. Broadly speaking then they increased their borrowing in order to pay almost all of the £285m of dividend payment.

You will also have noticed that they spent a net £593.9m on investing activities.

Your argument is that they borrowed to pay dividends, whereas mine is that they borrowed to invest in property, plant and equipment. Their cash increased by £188.6m over the year, and presumably the debts repaid fell due in that year. In 2019 they repaid debts of £668.6m and only borrowed £568.4m, yet had a decrease in cash of (£172.8m).

The business generated plenty of cash. I think that your argument is spurious.

TJH

Arborbridge
The full Lemon
Posts: 10439
Joined: November 4th, 2016, 9:33 am
Has thanked: 3640 times
Been thanked: 5272 times

Re: TJH Portfolio adjustment

#342652

Postby Arborbridge » September 24th, 2020, 11:52 pm

tjh290633 wrote:
Wizard wrote:Having looked at that cashflow statement I see that they did indeed leave a number of chunky figures out of the paragraph where you sourced the numbers you first quoted. Amongst other things the fact they took out new debt of £805.4m while only repaying old debt of £545.9m, so new borrowings contributed roughly £260m of additional cash. Broadly speaking then they increased their borrowing in order to pay almost all of the £285m of dividend payment.

You will also have noticed that they spent a net £593.9m on investing activities.

Your argument is that they borrowed to pay dividends, whereas mine is that they borrowed to invest in property, plant and equipment. Their cash increased by £188.6m over the year, and presumably the debts repaid fell due in that year. In 2019 they repaid debts of £668.6m and only borrowed £568.4m, yet had a decrease in cash of (£172.8m).

The business generated plenty of cash. I think that your argument is spurious.

TJH


In a way, I'm glad you both disagree about this, as it confirms what I've always thought: it ain't so easy!

I've also included in my table the net gearing. The reason for doing this is that I've made the broad assumption that the gearing would be increasing if there was trouble afoot. It's possible for borrowings to increasing to feed the capital requirement/dividend, but does this really matter if the net gearing is constant?

All in all, seeing the dividend uncovered does not make me happy, and I am not convinced that TJH's argument is correct. The business generated plenty of cash, so why didn't the net cash per share minus capex cover the dividend?

I would be nice to have a contribution from an accountant experienced in these matters.

Arb.

Wizard
Lemon Quarter
Posts: 2829
Joined: November 7th, 2016, 8:22 am
Has thanked: 68 times
Been thanked: 1029 times

Re: TJH Portfolio adjustment

#342658

Postby Wizard » September 25th, 2020, 12:44 am

tjh290633 wrote:
Wizard wrote:Having looked at that cashflow statement I see that they did indeed leave a number of chunky figures out of the paragraph where you sourced the numbers you first quoted. Amongst other things the fact they took out new debt of £805.4m while only repaying old debt of £545.9m, so new borrowings contributed roughly £260m of additional cash. Broadly speaking then they increased their borrowing in order to pay almost all of the £285m of dividend payment.

You will also have noticed that they spent a net £593.9m on investing activities.

Your argument is that they borrowed to pay dividends, whereas mine is that they borrowed to invest in property, plant and equipment. Their cash increased by £188.6m over the year, and presumably the debts repaid fell due in that year. In 2019 they repaid debts of £668.6m and only borrowed £568.4m, yet had a decrease in cash of (£172.8m).

The business generated plenty of cash. I think that your argument is spurious.

TJH

You started by saying...

I'm puzzled by your figures, Arb. https://www.investegate.co.uk/united-ut ... 00086888N/ shows that for the year to 31 Mar 2020 the Net cash flow was £810m and the cost of dividends was £284m. The previous year the Net Cash Flow was £832m, and the cost of Dividends was £274m.

That looks covered to me.

The net cash flow for UU. was not £810m.

You then went on to say...
Look at the Cash Flow statement.

There was an increase in cash at the end of the year in 2020 of £188.6m, compared with a decrease of (£172.8m) in 2019.

If there was an increase, then there has to have been a surplus of cash.

But that surplus was only there because they increased borrowing, you seem to have missed that point.

The figures from the link you provided are...
UU. generated cash from operations of £810.3m
UU. invested cash of £593.9m in the business
That means the cash left after the investments was £216.4m
But UU. paid a dividend of £284.5m.
It is very simple, they had insufficient cash to pay the dividend without increasing debt.

[Deletion.] First you said they had a massive cash surplus, then you said they had a smaller cash surplus without realising that resulted from an increase in borrowing, now you seem to accept that without increasing debt they would have had a cash deficit but say that is not a reason to be concerned about the dividend because if they could not borrow money they would just stop investing in the business in order to keep paying the dividend.

Moderator Message:
Speculation about another poster's motivations and the unnecessarily personal bit at the end removed. - Chris

Wizard
Lemon Quarter
Posts: 2829
Joined: November 7th, 2016, 8:22 am
Has thanked: 68 times
Been thanked: 1029 times

Re: TJH Portfolio adjustment

#342659

Postby Wizard » September 25th, 2020, 1:00 am

Arborbridge wrote:
tjh290633 wrote:
Wizard wrote:Having looked at that cashflow statement I see that they did indeed leave a number of chunky figures out of the paragraph where you sourced the numbers you first quoted. Amongst other things the fact they took out new debt of £805.4m while only repaying old debt of £545.9m, so new borrowings contributed roughly £260m of additional cash. Broadly speaking then they increased their borrowing in order to pay almost all of the £285m of dividend payment.

You will also have noticed that they spent a net £593.9m on investing activities.

Your argument is that they borrowed to pay dividends, whereas mine is that they borrowed to invest in property, plant and equipment. Their cash increased by £188.6m over the year, and presumably the debts repaid fell due in that year. In 2019 they repaid debts of £668.6m and only borrowed £568.4m, yet had a decrease in cash of (£172.8m).

The business generated plenty of cash. I think that your argument is spurious.

TJH


In a way, I'm glad you both disagree about this, as it confirms what I've always thought: it ain't so easy!

I've also included in my table the net gearing. The reason for doing this is that I've made the broad assumption that the gearing would be increasing if there was trouble afoot. It's possible for borrowings to increasing to feed the capital requirement/dividend, but does this really matter if the net gearing is constant?

All in all, seeing the dividend uncovered does not make me happy, and I am not convinced that TJH's argument is correct. The business generated plenty of cash, so why didn't the net cash per share minus capex cover the dividend?

I would be nice to have a contribution from an accountant experienced in these matters.

Arb.

Your point on gearing is a good one. A growing business can increase debt but maintain a stable gearing ratio, giving no concern. A stable level of gearing, as long as it was not too high to start with, is a good sign.

Arborbridge
The full Lemon
Posts: 10439
Joined: November 4th, 2016, 9:33 am
Has thanked: 3640 times
Been thanked: 5272 times

Re: TJH Portfolio adjustment

#342674

Postby Arborbridge » September 25th, 2020, 7:41 am

Wizard wrote:Your point on gearing is a good one. A growing business can increase debt but maintain a stable gearing ratio, giving no concern. A stable level of gearing, as long as it was not too high to start with, is a good sign.


The gearing is pretty high - higher than we would normally recommend - but with a utility it is usually reckoned one can bend the rules a little (unless there is a corbynite takeover of the economy).

However, my request is geniune for someone with a greater knowledge of company accountancy to explain the trick. How is the dividend being kept afloat with negative cash cover, and will it continue?

The best conclusion is that there is much capital expansion going on which will eventually lead to a much larger business. The difficult question for me here is: is that really going to bring in sizeable profits in the future or is it a hidden maintenance cost which is necessary to keep the show on the road (or under it!). Laying a pipe to a new housing estate might be real expansion, but if you need to replace all the old sewers and pipes as a consequence, but which would have needed replacement soon anyway?

Same question may be relevant for holders of SSE, but the UU case is more stark.

Arb.

TUK020
Lemon Quarter
Posts: 2042
Joined: November 5th, 2016, 7:41 am
Has thanked: 762 times
Been thanked: 1178 times

Re: TJH Portfolio adjustment

#342688

Postby TUK020 » September 25th, 2020, 9:10 am

Net cash generated from continuing operating activities for the year ended 31 March 2019 was £810 million, and therefore broadly consistent with £832 million in the previous year. The group's net capital expenditure was £645 million, principally in the regulated water and wastewater investment programmes. This excludes infrastructure renewals expenditure which is treated as an operating cost under IFRS. Cash flow capex differs from regulatory capex, since regulatory capex includes infrastructure renewals expenditure and is based on capital work done in the period, rather than actual cash spent.
[/quote]

I think there are some clues here as to what is creating the confusion.

My accounting is pretty rusty, but I think that:
Free Cash Flow = Cash generated from operations - CAPEX required to maintain those operations

Free Cash Flow can then be used to pay down debt + dividends + New CAPEX investments.
They expalin here that the net CAPEX quoted here excludes infrastrutucre renewals.

As far as I can make out, they are quoting apples and oranges figures here so you can't do simple maths to get FCF;
Suggest this is posted on teh Company Analysis board, to see if there is anyone who gets their kicks out of going back to the source accounts and working it all out.

moorfield
Lemon Quarter
Posts: 3547
Joined: November 7th, 2016, 1:56 pm
Has thanked: 1580 times
Been thanked: 1414 times

Re: TJH Portfolio adjustment

#342699

Postby moorfield » September 25th, 2020, 9:57 am

Arborbridge wrote:All in all, seeing the dividend uncovered does not make me happy, and I am not convinced that TJH's argument is correct. The business generated plenty of cash, so why didn't the net cash per share minus capex cover the dividend?

I would be nice to have a contribution from an accountant experienced in these matters.


I am not a HYP investor so shouldn't really be posting here (I am a PHYS investor), and neither am I an accountant but I'll have a go. Dividends are paid from retained earnings of which UU has £2bn on its balance sheet - so no problems there - and those earnings arise from P&L accumulated over many years irrespective of how the company is funded by its equity/debt mix. However retained earnings are also usually not liquid but wrapped up in fixed assets or, worse, intangible assets - which is why dividends get rebased from time to time or a company appears to borrow because cashflow cannot cover them. I don't have my own (Oakley analyzed) UU numbers to hand but I recall that capex is routinely ~70% of free cashflow, and asset turnover is <<1 ie. inefficient. A similar picture to SSE.

tjh290633
Lemon Half
Posts: 8266
Joined: November 4th, 2016, 11:20 am
Has thanked: 918 times
Been thanked: 4130 times

Re: TJH Portfolio adjustment

#342710

Postby tjh290633 » September 25th, 2020, 10:32 am

moorfield wrote:
Arborbridge wrote:All in all, seeing the dividend uncovered does not make me happy, and I am not convinced that TJH's argument is correct. The business generated plenty of cash, so why didn't the net cash per share minus capex cover the dividend?

I would be nice to have a contribution from an accountant experienced in these matters.


I am not a HYP investor so shouldn't really be posting here (I am a PHYS investor), and neither am I an accountant but I'll have a go. Dividends are paid from retained earnings of which UU has £2bn on its balance sheet - so no problems there - and those earnings arise from P&L accumulated over many years irrespective of how the company is funded by its equity/debt mix. However retained earnings are also usually not liquid but wrapped up in fixed assets or, worse, intangible assets - which is why dividends get rebased from time to time or a company appears to borrow because cashflow cannot cover them. I don't have my own (Oakley analyzed) UU numbers to hand but I recall that capex is routinely ~70% of free cashflow, and asset turnover is <<1 ie. inefficient. A similar picture to SSE.

As I understand it, infrastructure companies regularly borrow to fund capital investment. Before privatisation they were exclusively users of loan capital, with no equity. The borrowing is to fund capital investment. This is normal.

TJH

Gengulphus
Lemon Quarter
Posts: 4255
Joined: November 4th, 2016, 1:17 am
Been thanked: 2628 times

Re: TJH Portfolio adjustment

#342727

Postby Gengulphus » September 25th, 2020, 11:03 am

With the quoting from https://www.investegate.co.uk/united-ut ... 00086888N/ repaired:

TUK020 wrote:
Net cash generated from continuing operating activities for the year ended 31 March 2019 was £810 million, and therefore broadly consistent with £832 million in the previous year. The group's net capital expenditure was £645 million, principally in the regulated water and wastewater investment programmes. This excludes infrastructure renewals expenditure which is treated as an operating cost under IFRS. Cash flow capex differs from regulatory capex, since regulatory capex includes infrastructure renewals expenditure and is based on capital work done in the period, rather than actual cash spent.

I think there are some clues here as to what is creating the confusion.

My accounting is pretty rusty, but I think that:
Free Cash Flow = Cash generated from operations - CAPEX required to maintain those operations

Free Cash Flow can then be used to pay down debt + dividends + New CAPEX investments.
They expalin here that the net CAPEX quoted here excludes infrastrutucre renewals.

As far as I can make out, they are quoting apples and oranges figures here so you can't do simple maths to get FCF; ...

They do say "excludes infrastructure renewals expenditure which is treated as an operating cost under IFRS" (my bold). That suggests (*) that the infrastructure renewals expenditure it is talking about is already taken into account (as a deduction) in cash generated from operations, and so the exclusion is there to avoid double-counting it by deducting it again. If that's the case, the deduction used in calculating free cash flow should be based on the net capex figure of £645m and not from the regulatory capex figure, for the same reason.

And your recollection of the free cash flow calculation needing to deduct 'maintenance' capex and not to deduct 'new' capex is entirely in accordance with my recollection. That need has always been the Achilles heel of free cash flow as far as I am concerned, as it is rare for company accounts to give a breakdown into the two types of capex (**). There are various methods involving using depreciation figures for estimating maintenance capex, but they have various sources of error to do with inflation and the useful lifetime of capital equipment not necessarily matching its depreciation period, and for capital-intensive industries, the percentage errors can be magnified considerably by the difference-of-two-large-numbers effect (***).

The result is that personally, I've given up even trying to calculate free cash flow myself, and I treat free cash flow figures from free third-party sources with considerable scepticism because I suspect they use over-simplistic calculation methods very uncritically to keep costs down. IMHO keeping an eye of a company's net debt (or occasionally net cash) probably does about as good a job of keeping track of its cash situation, and although one needs to watch out for companies 'hiding' debt, I prefer that to the uncertainty about the maintenance-vs-new capex breakdown issue that affects almost every company.

(*) "suggests" because I haven't looked at the accounts in detail and so haven't verified whether it actually is deducted in the calculation of cash generated from operations - I'm just trying to provide pointers where people might look for the resolution of this issue here, not trying to resolve it myself as I currently lack both the time and the inclination to dig into accounts!

(**) And probably quite difficult for companies to do so - if you replace an old bit of kit that has reached the end of its useful life with a new bit of kit with better functionality, how much of the cost of the new bit of kit do you attribute to maintaining the company's existing capabilities and how much to adding new capabilities?

(***) The effect that says e.g. that if you calculate a figure as £110m - £100m = £10m, and each of the £110m and £100m figures are subject to a +/-1% possible error, the £10m result is subject to a +/-21% possible error.

Gengulphus

moorfield
Lemon Quarter
Posts: 3547
Joined: November 7th, 2016, 1:56 pm
Has thanked: 1580 times
Been thanked: 1414 times

Re: TJH Portfolio adjustment

#342745

Postby moorfield » September 25th, 2020, 11:57 am

tjh290633 wrote:As I understand it, infrastructure companies regularly borrow to fund capital investment. Before privatisation they were exclusively users of loan capital, with no equity. The borrowing is to fund capital investment. This is normal.


Yes I would agree. The Capex/Free Cash ratio is a guesstimate of "stay in business" cost which conservatively assumes a company cannot borrow to invest, which in practice most do. Its use is to flag up the companies which rely more heavily than others on that borrowing ability. Cash Profits (Oakley) or Owner Earnings (Buffet) computations are more complicated but do strip that borrowing out of the picture iirc.

moorfield
Lemon Quarter
Posts: 3547
Joined: November 7th, 2016, 1:56 pm
Has thanked: 1580 times
Been thanked: 1414 times

Re: TJH Portfolio adjustment

#343178

Postby moorfield » September 27th, 2020, 12:11 pm

Here are my own numbers for UU. The Cash Profits calculation strips out working capital changes which can manipulate FCF. See Oakley Chapter 10 for an excellent explanation.


I'm still unsure how UU does cover its dividend. Once I have found a more convincing replacement I will dispose of it. But that is for the future, I have a few other suspect dividend payers to deal with first.

tjh290633
Lemon Half
Posts: 8266
Joined: November 4th, 2016, 11:20 am
Has thanked: 918 times
Been thanked: 4130 times

Re: TJH Portfolio adjustment

#343427

Postby tjh290633 » September 28th, 2020, 11:47 am

When WMH rose by 40+% on Friday, I decided to trim them back today. There was about a 10% fall in reaction today, but I carried on regardless. Due to a typing error I only trimmed them by 23%, and the proceeds went into Aviva, adding 18% at 290p, IMI, adding 17% at 1055p and UU., adding 15% at 889p. All of course paying dividends, unlike WMH at the moment.

As a result, my top-up table now looks like this:

Top-up          Income                     Cost                
Rank EPIC Rank EPIC % Income Rank Epic % Cost
1 IMB* 1 LGEN 6.39% 1 AV. 4.67%
2 LGEN* 2 BATS 5.86% 2 PSON 4.36%
3 BP.*° 3 BP. 5.67% 3 BP. 4.35%
4 VOD* 4 IMB 5.19% 4 RDSB 4.34%
5 BLND+ 5 RIO 4.99% 5 LLOY 4.30%
6 RDSB° 6 SSE 4.90% 6 MARS 4.25%
7 SSE* 7 ADM 4.67% 7 GSK 4.14%
8 BATS* 8 VOD 4.62% 8 BT.A 4.09%
9 MKS+ 9 GSK 4.52% 9 MKS 3.93%
10 RIO* 10 NG. 4.50% 10 S32 3.63%
11 TATE 11 AV. 4.33% 11 TSCO 3.57%
12 MARS°+ 12 BHP 4.23% 12 BLND 3.55%

As is my custom, shares which contribute more than 4.2% to dividend income (*) are disqualified, those which account for more than 4.2% of portfolio cost (°) are also disqualified and those not paying dividends at the moment (+) are also disqualified.

As you will see, that rules out all of the top 12 contributing to income, and the top 6 for those accounting for cost. This is because topping up by 20% would take them over my arbitrary limit of 5% for each factor. This takes me down to TATE as the next eligible share. Further down the list we come to BAE Systems, PHP and IMI again. I might have to relax my 5% of income rule. It is a funny time.

As a result of the changes, my portfolio now looks like this:

Value                           
Rank EPIC Weight % Median
1 KGF 4.25% 141.2%
2 ULVR 3.52% 116.8%
3 AZN 3.51% 116.6%
4 UU. 3.39% 112.6%
5 ADM 3.39% 112.4%
6 BHP 3.33% 110.4%
7 GSK 3.32% 110.0%
8 WMH 3.24% 107.6%
9 AV. 3.23% 107.1%
10 DGE 3.19% 106.0%
11 NG. 3.19% 105.7%
12 RIO 3.16% 104.8%
13 TSCO 3.15% 104.7%
14 BATS 3.13% 103.7%
15 RB. 3.08% 102.1%
16 IMI 3.06% 101.7%
17 SGRO 3.02% 100.3%
18 PSON 3.02% 100.2%
19 BA. 3.01% 99.8%
20 PHP 2.94% 97.4%
21 SSE 2.90% 96.1%
22 TATE 2.77% 92.0%
23 S32 2.73% 90.7%
24 LGEN 2.57% 85.4%
25 BP. 2.57% 85.2%
26 VOD 2.42% 80.4%
27 SMDS 2.42% 80.3%
28 RDSB 2.21% 73.2%
29 BLND 2.19% 72.8%
30 IMB 2.09% 69.4%
31 CPG 1.99% 65.9%
32 TW. 1.98% 65.8%
33 BT.A 1.86% 61.9%
34 MARS 1.53% 50.6%
35 LLOY 1.42% 47.1%
36 MKS 1.22% 40.3%

WMH drops to 8th position, while UU. rises to 4th, AV. to 9th and IMI to 16th. Kingfisher remains the high flier. The distribution spread above the median point is now much narrower. Below the median it is much wider. The mean weight is rather lower, at 2.78% compared with the median of 3.01%. If my criterion for trimming were based on the mean instead of the median, Kingfisher would now be above that point, which is 4.17%. The prospects of more trimming lie with Kingfisher alone at this time.

TJH

Arborbridge
The full Lemon
Posts: 10439
Joined: November 4th, 2016, 9:33 am
Has thanked: 3640 times
Been thanked: 5272 times

Re: TJH Portfolio adjustment

#343441

Postby Arborbridge » September 28th, 2020, 12:33 pm

moorfield wrote:Here are my own numbers for UU. The Cash Profits calculation strips out working capital changes which can manipulate FCF. See Oakley Chapter 10 for an excellent explanation.


I'm still unsure how UU does cover its dividend. Once I have found a more convincing replacement I will dispose of it. But that is for the future, I have a few other suspect dividend payers to deal with first.


Those numbers are broadly similar to the ones I posted earlier in this thread, so I was on the right lines.

Arb.

monabri
Lemon Half
Posts: 8415
Joined: January 7th, 2017, 9:56 am
Has thanked: 1544 times
Been thanked: 3439 times

Re: TJH Portfolio adjustment

#343477

Postby monabri » September 28th, 2020, 1:53 pm

United Utilities

Is the uncovered dividend being held by being incorporated into the increasing debt?

The debt rises from £5.99 bn to £8.3bn over the time period shown.


Image from Simplywallstreet
https://simplywall.st/stocks/gb/utiliti ... oup-shares

Image

The UU dividend costs ~ £0.39 x 683m shares = £266m per year.

http://financials.morningstar.com/ratio ... region=GBR

Arborbridge
The full Lemon
Posts: 10439
Joined: November 4th, 2016, 9:33 am
Has thanked: 3640 times
Been thanked: 5272 times

Re: TJH Portfolio adjustment

#343513

Postby Arborbridge » September 28th, 2020, 4:43 pm

monabri wrote:United Utilities

Is the uncovered dividend being held by being incorporated into the increasing debt?

The debt rises from £5.99 bn to £8.3bn over the time period shown.


Image from Simplywallstreet
https://simplywall.st/stocks/gb/utiliti ... oup-shares

Image

The UU dividend costs ~ £0.39 x 683m shares = £266m per year.

http://financials.morningstar.com/ratio ... region=GBR


I think that's the answer, but if that doesn't show up as an increase in net gearing, it does not offend our usual criteria. Though is still carrying more debt, if it is a "bigger" company it would therefore not seem to matter.

Arb.

Arborbridge
The full Lemon
Posts: 10439
Joined: November 4th, 2016, 9:33 am
Has thanked: 3640 times
Been thanked: 5272 times

Re: TJH Portfolio adjustment

#343515

Postby Arborbridge » September 28th, 2020, 4:47 pm

Additional: from the charts you published, it looks as though the debt to equity took a turn in the wrong direction 2019-2020, so not encouraging. The question about these factors is always: how significant, and at which point should one sit up and pay attention?

Arb.


Return to “HYP Practical (See Group Guidelines)”

Who is online

Users browsing this forum: No registered users and 73 guests