tjh290633 wrote:TUK020 wrote:Malcolm,
this leads to the opportunity to infer more meaning than the data warrants.
Terry's figures are nominal (he accounts for inflation comparison by tracking the total RPI factor for the period).
However, the rate of inflation has varied considerably over this period, and this means that the shape of the cart could be very misleading
tuk020
Here is a direct comparison between the dividend per unit and the RPI, both rebased to the same starting value:
.            Ordinary    Rebased     RPI
Year to      Divs/unit   Divs/unit   Rebased
05-Apr-88         2.86      100.00    100.00
05-Apr-89         2.72       94.81    112.28
05-Apr-90         4.24      147.94    122.89
05-Apr-91         5.42      189.25    130.75
05-Apr-92         7.52      262.34    136.35
05-Apr-93         6.91      241.32    138.11
05-Apr-94         6.27      218.85    141.65
05-Apr-95         7.48      261.07    146.37
05-Apr-96         7.38      257.48    149.90
05-Apr-97         8.40      293.36    153.54
05-Apr-98         8.88      310.04    159.72
05-Apr-99         8.46      295.34    162.28
05-Apr-00        11.33      395.51    167.09
05-Apr-01        11.73      409.64    170.04
05-Apr-02        13.02      454.50    172.59
05-Apr-03        12.10      422.26    178.00
05-Apr-04        11.62      405.63    182.42
05-Apr-05        12.07      421.42    188.21
05-Apr-06        13.12      458.13    193.03
05-Apr-07        14.04      490.19    201.77
05-Apr-08        24.32      849.07    210.22
05-Apr-09        21.17      739.15    207.76
05-Apr-10        11.06      386.20    218.86
05-Apr-11        16.71      583.44    230.26
05-Apr-12        17.46      609.34    238.21
05-Apr-13        19.91      694.93    245.09
05-Apr-14        20.47      714.45    250.29
05-Apr-15        21.33      744.60    253.44
05-Apr-16        21.67      756.58    256.78
05-Apr-17        24.93      870.11    265.82
05-Apr-18        29.23    1,020.51    274.75
05-Apr-19        29.25    1,020.97    283.10
05-Apr-20        31.57    1,102.06    284.38
05-Apr-21        19.15      668.60    295.78
As you can see, dividends have been well ahead of inflation except for that second year, when timing of dividends received was a little awry.
TJH
Since the 1970's/1980's there's been a transition from high to low interest rates/inflation, a rising tide effect for investors, even inflation bonds have provided around 4% annualised real gains. The tendency is toward similar rising prices/income values in real terms.
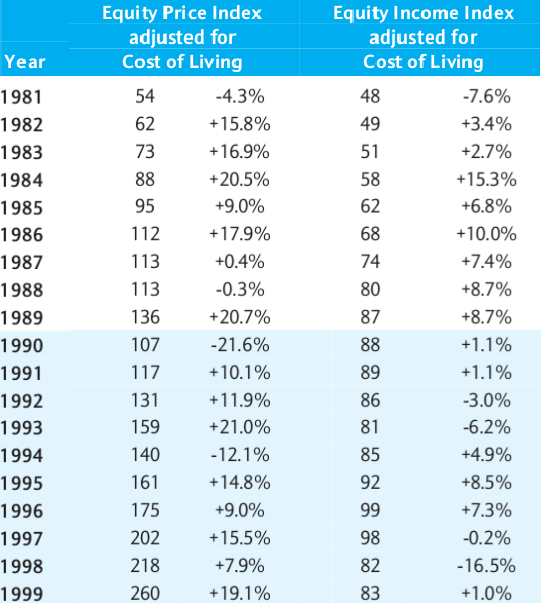
Counter cycle, interest rates/inflation rising from low levels tends to see the opposite
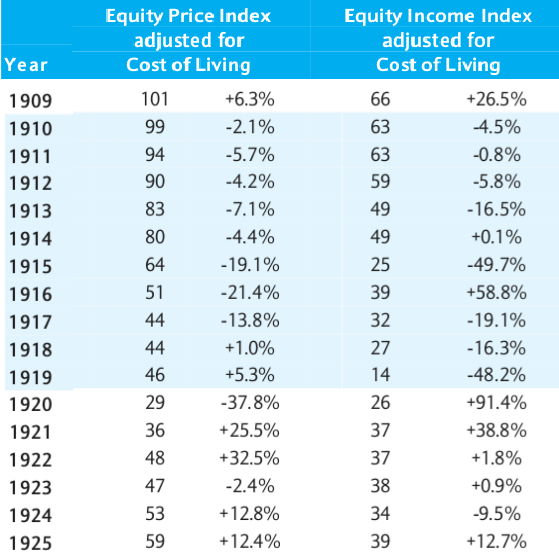
Both of those are extracts from the Barclays Equity Gilt study
A 'normal' situation across a period of multi-year/decade low to high interest rate transition trend will tend to see the likes of individuals with perhaps a former £1M home value, £1.1M in investments/savings (combined £2.1M), seeing that drop to a third or lower if they're also drawing a income/spending dividends (£700K total wealth) ... from where it starts to recover again (re-cycles all over again).
Former multi-millionairers falling to less than a million type situation, feeling a lot poorer than before.
Income wise and from the peak (2.1M) drawing a 4% SWR (40K odd from 1M liquid portfolio value) to when the value is at/toward the lows (700K wealth, 350K stock portfolio value) and that 40K income rises to being 11% of the portfolio value type amounts. Whilst the sustainability of that seems like a tall order historically that has been supported i.e. gains from the lows tend to be good enough such that 11% type withdrawals sustained through to cover to 30 years total drawdown. To leave some (PWR) you had to drop to more like 3% SWR i.e. around 9% of portfolio value withdrawal rates at the lows.
If your period covers the high to low interest rate transition period then good/great gains will tend to be evident, pretty much no matter what you might have invested in across the exceptionally high interest rates/inflation 1970's/1980's to recent period. That should not however be considered as being representative of the broader average reward expectancy.
Forward time is likely to be harder for those entering retirement if they haven't already accumulated enough. For those accumulating it likely will be good, cost averaging into lower prices buys more shares than otherwise might have been the case. But that all broadly washes. Above average accumulation/below average drawdown, or below average accumulation/above average drawdown ... broadly the two compare equally overall.
Critical however is not to expect too much income production/spending from the high present valuation levels. 5% yield/dividends/SWR if/when valuations fall to a third = 15% comparable rate which is most likely unsustainable. £700K wealth, £350K stock value, drawing/spending 50K type example figures. If anything you should go the other way, reduce to a 3% SWR type withdrawal rate. As I understand it that is a common practice for HYP'ers i.e. don't spend all of the dividends, reinvest some.
I suspect that forward time, someone looking back at a similar table to yours Terry might see more a case of the second image/table outcome. Likely not as bad, but something along those lines.


