City of London Investment Trust (CTY). and less often Merchants Trust (MRCH), are cited by some as a one-stop alternative to a High Yield Portfolio. One can see why. They have smoother records of raising dividends and seem less in danger of winding up too dependent on a few stocks in a portfolio of limited size.
Superficies apart, do these venerable trusts live up to their steady-Eddy renown? Here is a 22-year comparison of income delivery and capital performance, including volatility, between them and the 'Basket of Eight' (B8) of which both are members.
The B8 (briefly a B10) was devised in 2010 and back-calculated to HYP1's launch date on Nov. 12, 2000. Introducing the idea on The Motley Fool, I noted that in 2000 a commenter called MrCarlisle had suggested that CTY, MRCH or British Assets (now abrdn Diversified Income & Growth) might do a HYP-like job: all were oldies, if not golden. I chucked out British Assets when the Ten was narrowed down to Eight because it had behaved unremarkably and unpredictably in the early 2000s. CTY and MRCH made the cut.
It is assumed that £75,000 gross was invested in equal amounts before 1% purchase expenses, with no later dividend reinvestment or capital top-ups. Compound annual growth rates (CAGRs) are timed to eliminate arbitrary variations in dividend entitlements arising before Jan. 2002. Deflation is by the Retail Prices Index; inflation compounded at 3.5% pa through the timespan, but the latest horrific number is 14.2%. It is assumed this will be Dec.'s as well.
The story so far (1):
City of London Investment Trust (CTY) est. 1891, portfolio in 2010 c. £500m. Managed by Janus Henderson, previously by Touche Remnant since 1970 which Henderson absorbed. Job Curtis has been lead manager since 1983, now in his mid-sixties.
Dividends increased annually since the modern UK tax regime began in the mid-1960s. Aims at rough 50:50 split between capital gain and income to obtain above-market total return: holds 50-100 larger UK stocks, plus a few foreign issues, under one-tenth of net assets. Not keen on using options or debt to boost running yield; gearing generally 5-10%.
Merchants Trust (MRCH) est. 1889. Run by Allianz, lineal descendant of original managers. Portfolio was same size in 2010 as CTY's, with 46 equity positions plus options and derivatives. Dividends have risen each year since 1981-82. Simon Gergel has been lead manager since 2006, now in late fifties. Gearing may run up to 20% (25% official maximum) with much call option writing to supplement revenue receipts. Mandate prioritises income generation, albeit with 'long-term' capital growth hoped for as well.
Both trusts are benchmarked to the FT All-Share Index (FTAS).
INCOME
Totals for 2022 (£)...Change from 2021 (%)...Totals since launch (£)...CAGR 2002-22 (%)...Number of real falls, year-on-year (out of 19 changes, 2002-22)
CTY: 6,926...+4.2...100,710...6.0...5
MRCH: 5,426...+0.7...94,152...2.8...14
B8: 5,758...+3.1...89,054...4.2...7
CTY's yearly payout began to exceed MRCH's in 2014-15: £1,500 more in 2021-22. Absent policy changes it is hard to see MRCH catching up. CTY has been 'growthier' from a lower starting yield, like the Basket of Seven against the Basket of Eight; its historic versus in Nov. 2000 was 2.9% to MRCH's 4.3%. On average, CTY has yielded one-fifth more than the All-Share Index at financial year ends; MRCH, almost three-fifths more. The tortoise v. hare syndrome.
DERISKING
If purchasing power must be safeguarded, you can set a portion of receipts aside in a reserve, to supplement subinflationary income in times such as these. Spendable income will then pace the RPI and should never buy less than at the outset. The 'safety margin' is the percentage of accumulated receipts held back since 2000.
Amount withdrawn (£)...Safety margin (%)...CAGR of withdrawn amount (%)...Average reserve as months' worth of current payout, 2000-22...Reserve in months at end-2022...Average yield on capital (%) for amount withdrawn:
CTY: 85,195...8...6.6...13...14...4.0
MRCH: 90.869...3...5.1...11... 6...5.2
B8: 84,282...5...4.5...7...9...4.2
CTY furnished £5,700 less spendable income than MRCH, but with a safety margin of 8% to 3%. The reserve in the holder's hands at Jun. 2022 would be 13 months rather than MRCH's 11. The bigger annual appropriation for derisking makes up for for CTY's only eccentricity: it habitually runs a very low revenue reserve, six months at the latest year end. Merchants sported a rather full reserve, but it has come down from 13 to seven months in two years: possibly another brake on future inflation-matching rises .
ANNUAL WITHDRAWAL YIELDS (%)
CTY: Years 1-5: 3.5...6-16: 4.4...17,18: 5.3...19-22: 6.3
Time-weighted average: 4.8
Maximum reserve: 19 months (2019)
MRCH: Years 1-3: 3.6...4-22: 4.8
Time-weighted average: 4.6
Maximum reserve: 13 months (2010-2014)
B8: Years 1-9: 3.3...10-22: 3.9
Time-weighted average: 3.6
Maximum reserve: 12 months (2009)
The table shows what set-asides could have meant for your pocket; how spendable income, as a yield on the £75,000 subscription, might have grown, if jacking up the abstraction rate was affordable without imperilling the kitty.
Despite distributing less for almost 15 years, CTY has come on stronger in the latest seven. It averaged 4.8%+RPI spendable to MRCH's 4.6% and the whole basket's 3.6%. CTY's faster dividend growth permitted three increases during the 22 years, whereas MRCH has stuck on 4.8%+RPI since Year 4. Both trusts run a revenue reserve after double derisking (theirs and the holder's) half as big as the B8 as a whole. But with the swift snapback in companies' dividends after covid, most UK Equity Income trusts are pushing their revenue up quickly and rebuilding reserves-- see, for example, abrdn Equity Income's annual report last week. If such repair work can continue, there should be no fear for the 'dividend hero' status of our two.
CAPITAL
Time-weighted payouts from these models compare well with what a seller of index-linked annuities could quote you, e.g. under 5% for a 65 y.o. single male. Besides, portfolios let you hang on to capital and keep your options open if a better solution should present itself. How much capital, though?
Value at Nov. 11, 2022 (£)...Real change in year (%)...Real CAGR since launch (%)...Number of real falls year-on-year (out of 22 changes, 2000-22)
CTY: 128,752... -15.6...-1.2...10
MRCH: 109,098...-14.6...-1.7...12
B8: 120,333...-18.6...-1.3...10
-----------------------------------------------------
FTSE 100: 7318.04...-14.6...-2.7...10
FT All-Share: 4036.84...-18.0...-2.2...10
Taking the original £75,000 principal as 100, in deflated terms after 22 years CTY is 77 (2021: 92), MRCH 68 (80) and the B8 75 (92). The FTSE100 is 55 (64) and the All-Share 62 (75). Everything has shrunk, but not equally; CTY's superior outturn accompanied a lustier, though more erratic, income growth rate. The combination should attract share buyers if it is not being won by investing in overpaying companies... and the objective forbids that.
Merchants's secondary aspiration, to eventual capital growth, is another story. Purchasing power has shrivelled by one=third since late 2000. The most MRCH can claim is that London-listed equities in total did worse.
Neither trust guarantees purchasing power over short spells. CTY's declined year on year almost half the time, MRCH's more than half. But CTY's capital marched with the B8 as a group while it supplied more than average income.
Nor did this yield edge entail more swings in value; at least not during the last three years gauged by FE Trustnet's Risk Scores. Taking cash as 0 and the Footsie as 100, the B8's share prices blended to 114. CTY scored 103, the lowest of the octet, MRCH 128, the fourth highest. Mr Curtis has walked the tightrope with fewer wobbles.
I do not recommend income ITs for accumulating capital, though you could do worse. Example: suppose £37,000 gross (equivalent of £75,000 in late 2000) was invested in CTY in Jul. 1983 and dividends ploughed back into more of the same. By Jun. 30, 2022 cash-in value before taxes would be £2.23m after a total return of 11% pa, c. 7.5% pa real. Potential income would be £109,000 pa if divis were henceforth spent, not reinvested. Without dividend recycling, the capital would be worth £518,000, a quarter as much.
That long-haul comparison does not disgrace MRCH. From 1983 to 2022 its total return was 10.6% nominal or ~7% real pa. MRCH would have delivered capital of £1.86m yielding potential income of £89,000 pa in mid-2022. Without income ploughback the capital value would be only £320,00 because of MRCH's relative share-price weakness.
OK, thirty-nine years is too long for most of us to be squirrelling for retiral. Over 20 years, comparisons are:
(CTY/MRCH/BB):
Average Ongoing Charges Ratio 0.43%/0.60%/0.63%
Average discount 2.6%/7.6%/6.1%
Dividend cover 1.00x/1.00x/1.01x
Yield 4.4%/5.5%/4.4%
Average ratio of yield to FTAS 120/157/120
Change in number of issued shrs (%) +119/+21/+25
CAGR per share (earnings/dividend/net assets/share price)
CTY 5.2/4.6/2.8/3.0
MRCH 2.2/2.5/1.7/1.9
B8 3.2/3.4/2.5/2.6
CTY's expense ratio has stayed markedly below MRCH's, another factor driving growthier performance. It could spread costs per share more thinly because its capital base more than doubled while MRCH's enlarged by only one-fifth, less than the B8 average. My comparisons chime with the punter's verdict: CTY was the better all-round deal because it did not chase the yield and planned for more later. Or as I used to put it: Good Enough Is Better Than Even Better.
As for the next few years, the case is made by the managers of Securities Trust of Scotland in today's annual report:
"A widespread repricing of fixed income markets and a less favourable policy backdrop makes for a more challenging environment for equity investment until greater value is apparent. This favours our investment style as well as the certainty of return from income in addition to longer term capital growth. When returns are plentiful, as they have been for years, the incremental return from income becomes less prized by investors. In more straitened times it becomes valuable once more. This is especially the case for those with irreplaceable capital and seeking a certain return to cover rising day to day expenses without having to dip into capital at times of stress."
---------------------------------------------------------------------------------------------------------------------------------
(1) More performance data and commentary on CTY and MRCH can be found by searching 'Basket of Seven/Eight' on the Investment Trusts board.
Got a credit card? use our Credit Card & Finance Calculators
Thanks to Wasron,jfgw,Rhyd6,eyeball08,Wondergirly, for Donating to support the site
CTY versus Merchants- who's juicier?
-
Luniversal
- 2 Lemon pips
- Posts: 157
- Joined: November 4th, 2016, 11:01 am
- Has thanked: 14 times
- Been thanked: 1163 times
-
Itsallaguess
- Lemon Half
- Posts: 9129
- Joined: November 4th, 2016, 1:16 pm
- Has thanked: 4140 times
- Been thanked: 10032 times
Re: CTY versus Merchants- who's juicier?
Luniversal wrote:
INCOME
Totals for 2022 (£)...Change from 2021 (%)...Totals since launch (£)...CAGR 2002-22 (%)...Number of real falls, year-on-year (out of 19 changes, 2002-22)
CTY: 6,926...+4.2...100,710...6.0...5
MRCH: 5,426...+0.7...94,152...2.8...14
B8: 5,758...+3.1...89,054...4.2...7
There's some guidance and tools available to help create much more readable images or data-tables Luni -
Posting images, or links to images, via the Imgur hosting site -
https://www.lemonfool.co.uk/viewtopic.php?f=21&t=11255
Posting a TABLE - simple example -
https://www.lemonfool.co.uk/viewtopic.php?f=21&t=8496
Video demo to show how to post Excel data-tables to these boards -
https://www.lemonfool.co.uk/viewtopic.php?f=27&t=16596
If you want to try out any of the above image or table-posting processes, then this site has a dedicated 'TEST' board that's regularly wiped clean, so you can have a play outside of the more permanent posting areas -
Testing 123... -
https://www.lemonfool.co.uk/viewforum.php?f=28
Cheers,
Itsallaguess
-
scotia
- Lemon Quarter
- Posts: 3569
- Joined: November 4th, 2016, 8:43 pm
- Has thanked: 2377 times
- Been thanked: 1949 times
Re: CTY versus Merchants- who's juicier?
As itsallaguess suggested - its easy to produce formatted data - this one uses the "table" construct
I currently hold Merchants - but not City of London
I currently hold Merchants - but not City of London
-
monabri
- Lemon Half
- Posts: 8428
- Joined: January 7th, 2017, 9:56 am
- Has thanked: 1549 times
- Been thanked: 3445 times
Re: CTY versus Merchants- who's juicier?
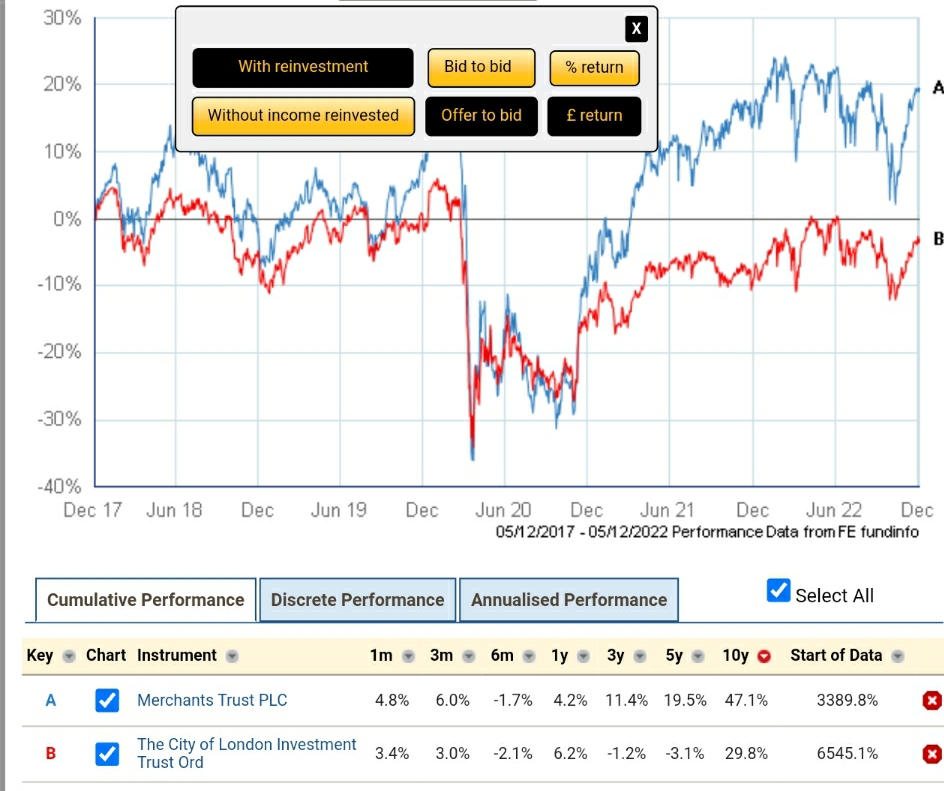
Source: https://www2.trustnet.com/Tools/Charting.aspx
A review over the last 10 years. Graphs are the previous 5 years, see tables below graphs for performance data for the last 10 years.
Dividends withdrawn.
Dividends reinvested

The start of data figures are " interesting".
Dividends reinvested......virtually no difference.
Dividends withdrawn.....CTY returns are higher. I don't know why there is such a discrepancy!
A review over the last 10 years. Graphs are the previous 5 years, see tables below graphs for performance data for the last 10 years.
Dividends withdrawn.
Dividends reinvested
The start of data figures are " interesting".
Dividends reinvested......virtually no difference.
Dividends withdrawn.....CTY returns are higher. I don't know why there is such a discrepancy!
Return to “High Yield Shares & Strategies - General”
Who is online
Users browsing this forum: No registered users and 35 guests