Page 4 of 4
Re: Total Return based portfolio for income
Posted: May 29th, 2021, 8:10 am
by funduffer
Dumbo wrote:Funduffer,
Surely a better comparison to City of London or Scottish Mortgage would have been the Average returns of the sectors they are in. Comparing a closet index tracker with the top performing Global IT is bit of a waste of time in my opinion.
Best wishes,
eddie
I am not trying to make any claims regarding the merits of CTY, SMT or a global index tracker.
I deliberately chose extreme examples, to illustrate the differences between generating income from a high yield IT and a growth IT and a passive low cost fund. I hope the OP finds it of interest. I always find a numerical example of benefit to back up opinions.
FD
Re: Total Return based portfolio for income
Posted: May 29th, 2021, 8:51 am
by Dod101
funduffer wrote:I am new to this thread.
I just did a model over 5 years - May 2016 to May 2021.just as an illustration to myself.
I compare a global equity (accumulation) tracker, Scottish Mortgage IT (SMT) and City of London IT (CTY) as vehicles for generating income.
I assume £100K is invested in May 2016, and each May income is withdrawn equal to that yielded by CTY in the previous year.
So for CTY, no shares are sold, and the income comes purely from dividends
For SMT, some income comes from dividends, and the rest is generated by selling down enough shares each year to generate the same income as CTY.
For the tracker, I assume units are sold each May to generate the same income as CTY,
Results after 5 years:
CTY: £24005 total dividend income generated, Capital value = £103359
SMT: £24005 income (£5853 dividends + £18152 from capital), Capital value = £422076
Tracker: £24005 income (all from capital), Capital Value = £171922
Interesting, but I am not sure how it would look in a bear market, although there has been a pandemic in the last 5 years!
FD
These are very interesting figures I must say and although we can all get carried away with the amazing figures from SMT, the returns are calculated over a five year period which is reasonable I think. They reinforce the idea that income shares have been a very poor investment certainly in the UK in recent years. We all knew that I guess, but I am always wary of selling capital to sustain income, so I tend to go for both ends, dedicated income shares as well as shares offering a total return. Not surprisingly CTY simply reflects the UK income share market and even they are now using capital to bolster their income.
Dod
Re: Total Return based portfolio for income
Posted: May 29th, 2021, 10:00 am
by monabri
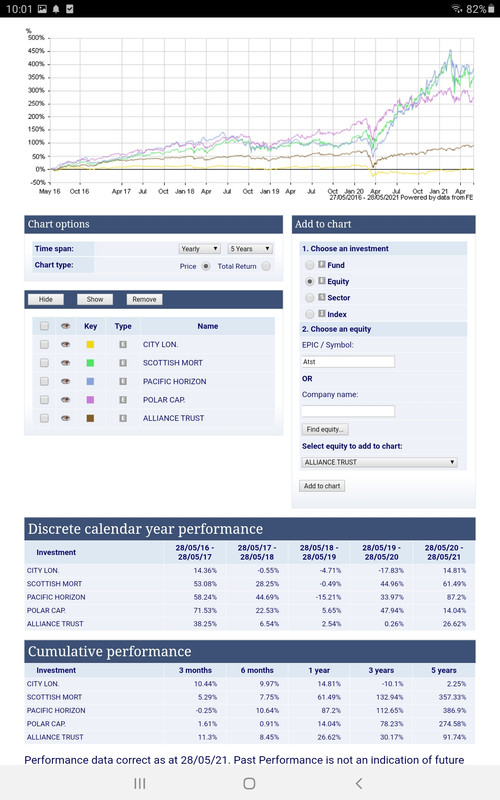
As long as one didn't cash in one's chips in Q1 2020 prior to SMT's shareprice ramping up.
(All data plotted using HL's comparison tool
https://www.hl.co.uk/funds/fund-discoun ... ion/charts )

Mind you, SMT is not alone in the popularity stakes!
Re: Total Return based portfolio for income
Posted: May 29th, 2021, 10:00 am
by swill453
funduffer wrote:CTY: £24005 total dividend income generated, Capital value = £103359
SMT: £24005 income (£5853 dividends + £18152 from capital), Capital value = £422076
Tracker: £24005 income (all from capital), Capital Value = £171922
Interesting, but I am not sure how it would look in a bear market, although there has been a pandemic in the last 5 years!
We've also done a Brexit, and CTY has obviously been exposed to the worst of that nightmare.
Scott.
Re: Total Return based portfolio for income
Posted: May 29th, 2021, 10:04 am
by Dod101
swill453 wrote:funduffer wrote:CTY: £24005 total dividend income generated, Capital value = £103359
SMT: £24005 income (£5853 dividends + £18152 from capital), Capital value = £422076
Tracker: £24005 income (all from capital), Capital Value = £171922
Interesting, but I am not sure how it would look in a bear market, although there has been a pandemic in the last 5 years!
We've also done a Brexit, and CTY has obviously been exposed to the worst of that nightmare.
Scott.
Which nightmare? Income shares were not doing well for a long while before Brexit.
Dod
Re: Total Return based portfolio for income
Posted: May 29th, 2021, 10:19 am
by Alaric
funduffer wrote:For the tracker, I assume units are sold each May to generate the same income as CTY,
Tracker: £24005 income (all from capital), Capital Value = £171922
Being pedantic, some of the tracker value arises from reinvested income. A better comparison might be to the Income version of the same fund. It was noticeable how in 2020, the quarterly income from the various FTSE100 trackers collapsed. Whilst share prices have recovered, the dividend yield on the FTSE 100 is around the 3% mark, whilst pre pandemic it was nudging 5% .
Re: Total Return based portfolio for income
Posted: May 29th, 2021, 10:31 am
by nmdhqbc
ReallyVeryFoolish wrote:Alaric wrote:funduffer wrote:For the tracker, I assume units are sold each May to generate the same income as CTY,
Tracker: £24005 income (all from capital), Capital Value = £171922
Being pedantic, some of the tracker value arises from reinvested income. A better comparison might be to the Income version of the same fund. It was noticeable how in 2020, the quarterly income from the various FTSE100 trackers collapsed. Whilst share prices have recovered, the dividend yield on the FTSE 100 is around the 3% mark, whilst pre pandemic it was nudging 5% .
A good observation. I think it is generally accepted that some UK dividend stocks were overpaying and that the pandemic was/is an excellent opportunity to reset the dividends at more sustainable levels. I think that is happening.
RVF
i think the capital value funduffer calculated has acc units sold to give income so in effect it's the same as holding inc units and selling some of them to make up the difference to CTY.
Re: Total Return based portfolio for income
Posted: May 29th, 2021, 1:49 pm
by dundas666
funduffer wrote:I am new to this thread.
Results after 5 years:
CTY: £24005 total dividend income generated, Capital value = £103359
SMT: £24005 income (£5853 dividends + £18152 from capital), Capital value = £422076
Tracker: £24005 income (all from capital), Capital Value = £171922
Interesting, but I am not sure how it would look in a bear market, although there has been a pandemic in the last 5 years!
FD
I love your approach and if I have time and can find the data I might look at expanding this to incorporate someone else's suggestion of comparing sector averages as it's rather unfair to compare anything to SMT! I might also include a G+I sector.
Re: Total Return based portfolio for income
Posted: May 30th, 2021, 9:37 am
by funduffer
Alaric wrote:funduffer wrote:For the tracker, I assume units are sold each May to generate the same income as CTY,
Tracker: £24005 income (all from capital), Capital Value = £171922
Being pedantic, some of the tracker value arises from reinvested income. A better comparison might be to the Income version of the same fund. It was noticeable how in 2020, the quarterly income from the various FTSE100 trackers collapsed. Whilst share prices have recovered, the dividend yield on the FTSE 100 is around the 3% mark, whilst pre pandemic it was nudging 5% .
True, but to keep things simple I chose an accumulation tracker, as it is easier to calculate.
I don't think choosing an income fund would change the answers significantly.