Donate to Remove ads

Got a credit card? use our Credit Card & Finance Calculators

Thanks to Rhyd6,eyeball08,Wondergirly,bofh,johnstevens77, for Donating to support the site

Morningstar X-Ray Tool on II - analysis issues

Closed-end funds and OEICs
Newroad
Lemon Quarter
Posts: 1096
Joined: November 23rd, 2019, 4:59 pm
Has thanked: 17 times
Been thanked: 343 times

Morningstar X-Ray Tool on II - analysis issues

#273336

Postby Newroad » December 25th, 2019, 12:40 pm

Hi All.

As you may recall from an earlier topic of mine (https://www.lemonfool.co.uk/viewtopic.php?f=54&t=20594) my family and I in general are invested in combinations of two Investment Trusts - one an International General and the other an International (High Yield) Bond.

I was looking at each of these using the X-Ray tool provided by II, which is I think a re-badged Morningstar tool. When I did so, I noticed two things

    There is no "Fixed Income Style" analysis - the 3*3 table is there but is not populated, for any of the three combinations - whereas the adjacent "Stock Style" is, and
    The combinations with FCIT and CMHY (kids Junior ISA's) are only 32.31% analysed - unlike the WTAN/HDIV (ISA) and ATST/IPE (SIPP) combinations - which are 100% analysed

Any ideas why?

Regards, Newroad

PS Compliments of the season to all!

monabri
Lemon Half
Posts: 8426
Joined: January 7th, 2017, 9:56 am
Has thanked: 1549 times
Been thanked: 3443 times

Re: Morningstar X-Ray Tool on II - analysis issues

#273469

Postby monabri » December 26th, 2019, 6:06 pm

Have you tried entering the details in the MS X-Ray tool?

http://tools.morningstar.co.uk/uk/xray/ ... geId=en-GB

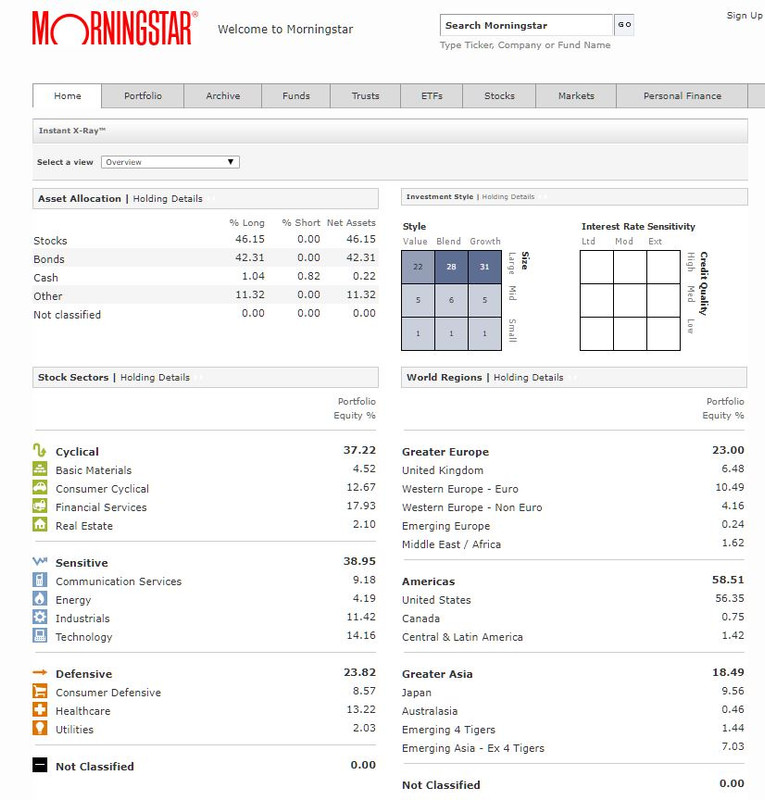
it seems to analyse the CMHY/FCIT to 100%. I note that the table marked "interest rate sensitivity" is blank. I wonder if "I.I." is reading info from the data in that 3x3 matrix?

Image

Image

Newroad
Lemon Quarter
Posts: 1096
Joined: November 23rd, 2019, 4:59 pm
Has thanked: 17 times
Been thanked: 343 times

Re: Morningstar X-Ray Tool on II - analysis issues

#273484

Postby Newroad » December 26th, 2019, 10:16 pm

Thanks, Monabri.

That's helpful on a number of levels.

On the question at hand

    Yes, the II data exhibits the same missing information from the 3*3 box on Interest Rate Sensitivity (though it labels it "Fixed Income Style"). This doesn't make sense to me given any material bond holding, and
    Similarly, the other derived Bond Stats are also missing from the MorningStar site, despite it knowing the bond geographies, and
    There is no apparent equivalent field to the "Percentage of Portfolio Analysed" field on MorningStar - in II it sits just below the "empty" 3*3 Fixed Income Style box. However, the "Stock Sectors" and "Fixed Income Sectors" on both seem to add up to 100% - so maybe the 32.31% analysed is just a presentation bug.

On other matters, the MorningStar tool is useful for "What If" modelling, which the II one appears not to be able to do (it just says what is) - so thanks for that. What I now know for this particular example is to get to the desired 67/33 - Stock/Bond & Other ratio, I need to go around 72/28 FCIT/CMHY on current holdings (this assumes "Other" is some form of "Fixed Income" holding, as opposed to, say, unlisted equity).

Similarly, to get 50/50 for WTAN/HDIV, I need to go around 53/47 and for 50/50 ATST/IPE, I need to (somewhat surprisingly) go around 48/52).

Regards, Newroad


Return to “Investment Trusts and Unit Trusts”

Who is online

Users browsing this forum: Bing [Bot] and 27 guests