Got a credit card? use our Credit Card & Finance Calculators
Thanks to eyeball08,Wondergirly,bofh,johnstevens77,Bhoddhisatva, for Donating to support the site
HYP1 vs TJH HYP vs FTSE250 Review
-
1nvest
- Lemon Quarter
- Posts: 4414
- Joined: May 31st, 2019, 7:55 pm
- Has thanked: 691 times
- Been thanked: 1346 times
HYP1 vs TJH HYP vs FTSE250 Review
Notes:
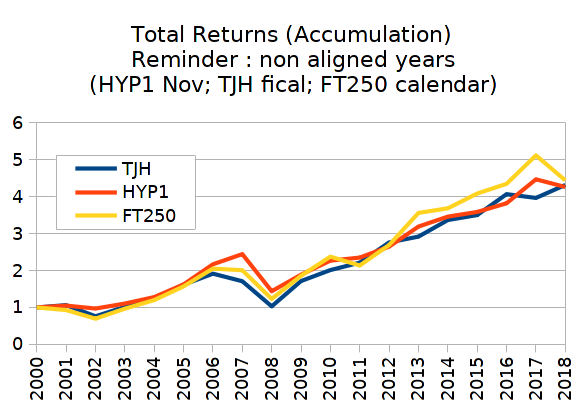
Misaligned years, April years for TJH HYP, November years for Pyad's HYP1, Calendar years for FTSE250. As a result of that, the most recent figures show a substantial relative decline in TJH HYP as that includes the Covid-19 dip/dive, whilst the other two don't.
FTSE250 figures/data are index figures, exclude costs/fees.
Missing years for HYP1 capital values between 2002 and 2014 (if anyone has those and would be prepared to share that would be nice).
Broadly, FTSE250 has seen around a 1.5% lower average dividend yield, but a 1.5% higher annualised gain. In retaining more, it grew relatively more/faster.
Excluding the most recent 12 months data so as to exclude the Covid-19 period, so 18 years of historic data for all three and ....
TJH HYP, summing the yearly dividends from April 2002 (end of 2001/2002 fiscal year) to April 2019 = £82,653, whilst capital grew from £75,000 in April 2001 to £144,757 (£69,757 increase) at April 2019. Combined £152,410.
HYP 1 sum of dividends from year end November 2001 to year end November 2018 = £84,967, whilst capital grew from £75,000 in November 2000 to £155,583 at the end of November 2018, a £80,583 increase. Combined £165,550.
FTSE250 sum of dividends from end of December 2000 to end of December 2018 = £66,742, whilst capital grew from £75,000 at the end of December 2000 to £125,432 at the end of December 2018. Combined £192,174
Of particular interest to me is that of the claim and validation in the US that simple buy and hold without making changes has historically tended to be better than making changes. Buy a diverse range of stocks in equal initial weighting and just leaving them to run does typically result in relatively heavy tilt towards a few stocks after a period of time, the set sort of finds its own cap weighting, but where perhaps a set of 16 stocks might have half of its value concentrated into maybe just 4 stocks. My thinking being that to dilute down those largest, top up the laggards to somewhat realign the set back towards more equal weightings would reduce concentration risk. Others have however noted that simply accepting such tilt and leaving things as they are tends to yield higher overall rewards on average. Looking at the above data I'm not really seeing any firm real confirmation of that. Taking end of 2016 (April 2017 for TJH) data for instance and the difference between capital values and dividend values at that time when comparing TJH HYP to HYP1 and there were negligibly small differences IMO.
Given the overall similarities I'm not really tempted by possible higher rewards from not rebalancing, I'd rather have lower concentration risk and not too much loaded into any one single stock. As I don't desire nor require higher dividends I'm similarly more inclined to stick with the likes of a low cost FTSE250 index tracker fund. I prefer the midcap over large cap as the midcap feeds both in and out of the top and bottom, so no single stock or sector tends to become relatively heavily weighted. It's rare for instance for the largest single stock to be 3% of the index total weighing, unlike large cap which can at times have 10% weighting into single stocks and sometimes even multiple heavily weighted stocks being in the same sector. The S&P500 is somewhat at such a point at present
-
Breelander
- Lemon Quarter
- Posts: 4179
- Joined: November 4th, 2016, 9:42 pm
- Has thanked: 1001 times
- Been thanked: 1855 times
Re: HYP1 vs TJH HYP vs FTSE250 Review
1nvest wrote:Missing years for HYP1 capital values between 2002 and 2014 (if anyone has those and would be prepared to share that would be nice).
These are all the Wayback Machine archived reports I know of.
HYP1 was reported quarterly in Fool articles, with the closest report to HYP1's y/e being October's...
VALUE INVESTING - Stephen Bland (TMFPyad) October 7, 2005
High Yield Portfolio Update - Stephen Bland | 11 October 2006
Edit: I have now found November reports:
HYP1 is 6: It Gets Better
HYP1 is 7: Still Doing The Business
Pyad left TMF so there was a gap, but on return in 2008 reports were then posted on the boards.
HYP1 ninth year summary
HYP1 is ten
HYP1 is 11
HYP1 is 12
HYP1 is 13
HYP1 is 14
HYP1 is 15 (which it looks like you already have)
-
IanTHughes
- Lemon Quarter
- Posts: 1790
- Joined: May 2nd, 2018, 12:01 pm
- Has thanked: 730 times
- Been thanked: 1117 times
Re: HYP1 vs TJH HYP vs FTSE250 Review
1nvest wrote:Missing years for HYP1 capital values between 2002 and 2014 (if anyone has those and would be prepared to share that would be nice).
Date      | HYP1
20-Nov-00 |  75,000.00
20-Nov-01 |  75,414.00
20-Nov-02 |  66,180.00
20-Nov-03 |  72,177.00
20-Nov-04 |  80,450.00
20-Nov-05 |  98,367.00
20-Nov-06 | 127,330.00
20-Nov-07 | 138,966.00
20-Nov-08 | 118,226.00
20-Nov-09 |  97,485.00
20-Nov-10 | 113,893.00
20-Nov-11 | 114,218.00
20-Nov-12 | 124,335.00
20-Nov-13 | 144,000.00
20-Nov-14 | 150,543.00
20-Nov-15 | 149,974.00
20-Nov-16 | 153,721.00
20-Nov-17 | 172,485.00
20-Nov-18 | 155,583.00
20-Nov-19 | 159,682.00
I cannot remember exactly when I retrieved the information that was missing from your post, nor where I found it, but I am sure it is as reported by pyad somewhere.
Ian
-
Breelander
- Lemon Quarter
- Posts: 4179
- Joined: November 4th, 2016, 9:42 pm
- Has thanked: 1001 times
- Been thanked: 1855 times
Re: HYP1 vs TJH HYP vs FTSE250 Review
IanTHughes wrote:I cannot remember exactly when I retrieved the information that was missing from your post, nor where I found it, but I am sure it is as reported by pyad somewhere.
I would question the source for your 2008 figure. Pyad left TMF and did not publish a 2008 report on any public forum AFAIK. Some Fools took on the task of tracking HYP1 in the 'wilderness years' and creating their own reports though.
But your others look accurate. I haven't checked them all against pyad's reports, but those I have checked look correct.
I have now found pyad's early years reports on the Wayback Machine.
Happy Birthday to the HYP - November 16, 2001
The High Yield Portfolio Is Two - November 15, 2002
Happy 3rd Birthday To The High Yield Portfolio - November 21, 2003
Four Years Of Beating The Market - November 19, 2004
HYP1 is 5: The End Of The Beginning - November 18, 2005
-
IanTHughes
- Lemon Quarter
- Posts: 1790
- Joined: May 2nd, 2018, 12:01 pm
- Has thanked: 730 times
- Been thanked: 1117 times
Re: HYP1 vs TJH HYP vs FTSE250 Review
Breelander wrote:IanTHughes wrote:I cannot remember exactly when I retrieved the information that was missing from your post, nor where I found it, but I am sure it is as reported by pyad somewhere.
I would question the source for your 2008 figure. Pyad left TMF and did not publish a 2008 report on any public forum AFAIK. Some Fools took on the task of tracking HYP1 in the 'wilderness years' and creating their own reports though.
You are right! I have just checked my complete records which have notes attached. The figure for 2008 was assuming a continuous downward trend from 2007 to 2009. The figure for 2008 is halfway between the two!
Sorry folks
Ian
-
Breelander
- Lemon Quarter
- Posts: 4179
- Joined: November 4th, 2016, 9:42 pm
- Has thanked: 1001 times
- Been thanked: 1855 times
Re: HYP1 vs TJH HYP vs FTSE250 Review
IanTHughes wrote:You are right! I have just checked my complete records which have notes attached. The figure for 2008 was assuming a continuous downward trend from 2007 to 2009. The figure for 2008 is halfway between the two!
As it turned out that was not a valid assumption, at least not according to one of the Fool's who created an independent report for the missing year....
kool4cats wrote:Value now ... 79984
...Considering the horrendous capital falls we have seen of late, HYP1 has held up remarkably well and is still up over 6% on its starting capital of £75,000. If we compare this to the FTSE100 we can see that the index has fallen by over 30% since its level in November 2000. HYP1 therefore keeps its record of beating the index in every year of its existence although as Stephen Bland has always cautioned, we shouldn’t rely on this necessarily always being the case in future.
https://web.archive.org/web/20161112154 ... 13197.aspx
-
IanTHughes
- Lemon Quarter
- Posts: 1790
- Joined: May 2nd, 2018, 12:01 pm
- Has thanked: 730 times
- Been thanked: 1117 times
Re: HYP1 vs TJH HYP vs FTSE250 Review
Got it!
From the report in 2009:
https://web.archive.org/web/20121215040 ... 43490.aspx
We see the following:
and
The second quote with the percentage increase in the capital of 26.9%, confirms that the capital in 2008 must have been as mentioned in the first quote.
How did I miss that?
Ian
From the report in 2009:
https://web.archive.org/web/20121215040 ... 43490.aspx
We see the following:
Looked at another way though, the capital at the start of year 9 was valued at £76,826.
and
Back on the secondary feature of capital, this has risen by 26.9% over the year which just beats the FTSE100 with its 26.2% rise.
The second quote with the percentage increase in the capital of 26.9%, confirms that the capital in 2008 must have been as mentioned in the first quote.
How did I miss that?
Ian
-
1nvest
- Lemon Quarter
- Posts: 4414
- Joined: May 31st, 2019, 7:55 pm
- Has thanked: 691 times
- Been thanked: 1346 times
Re: HYP1 vs TJH HYP vs FTSE250 Review
Great, thanks.
So filling in those gaps and if correct makes summary total returns (accumulation/dividends reinvested) data to the end of year 18 (rather than year 19, so the misaligned years and Covid-19 isn't a issue) of ...
Notes :
HYP1 having the lower volatility (stdev) is surprising.
Similar CAGR's but where HYP1 had the lower stdev. is indicative of a higher Sharpe Ratio (better risk adjusted reward). I use a quick and dirty CAGR / stdev calculation as a crude form of Sharpe Ratio measure - where the higher the number the better (at least if you consider volatility to be 'risk').
FT250 having a distinctly higher median than average (mean) is suggestive of a heavier left tail - skewed to the left, with a long tail of low scores pulling the mean down more than the median. Looking at a plot of the tails however and that's not so obvious - at least not to me.
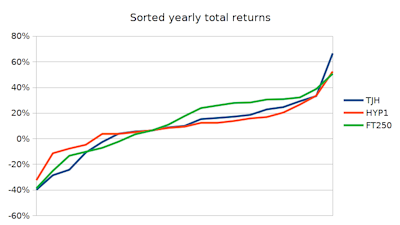
-
1nvest
- Lemon Quarter
- Posts: 4414
- Joined: May 31st, 2019, 7:55 pm
- Has thanked: 691 times
- Been thanked: 1346 times
Re: HYP1 vs TJH HYP vs FTSE250 Review
Opps. Thanks for the email Ian, corrected it now ...
Which adjusts the to end of year 18 figures to ...
Which adjusts the to end of year 18 figures to ...
-
1nvest
- Lemon Quarter
- Posts: 4414
- Joined: May 31st, 2019, 7:55 pm
- Has thanked: 691 times
- Been thanked: 1346 times
-
1nvest
- Lemon Quarter
- Posts: 4414
- Joined: May 31st, 2019, 7:55 pm
- Has thanked: 691 times
- Been thanked: 1346 times
Re: HYP1 vs TJH HYP vs FTSE250 Review
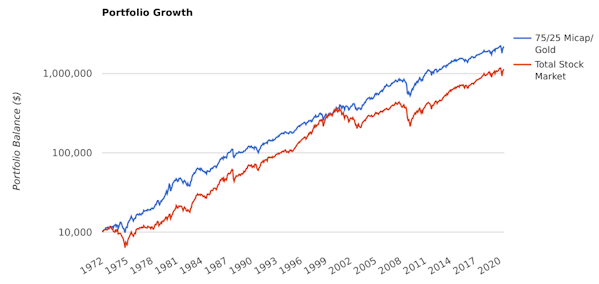
Adding some (20%) gold to the FT250
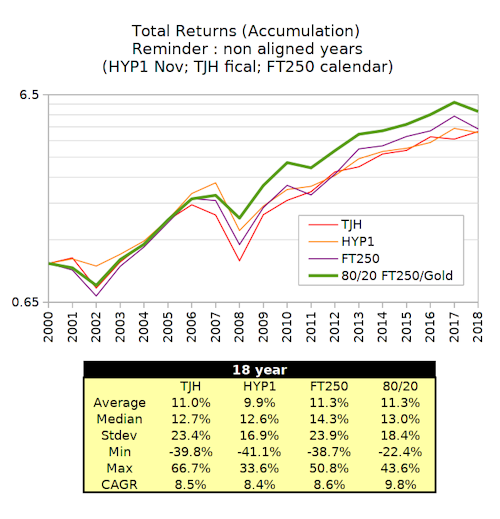
Why? Well take Iceland 2008 as a example. The Icelandic Krona halved relative to the US$. Imported products such as a Fridge doubled in price. House prices remained flat'ish. Broad inflation rose around 20%. Holding 20% in foreign currency or gold was a reasonable choice. Not ideal/optimal, but better than none.
If for instance your domestic currency halves, foreign (or gold) doubles and is 20% weighted then 0.8 domestic halves down to 0.4, whilst 0.2 foreign doubles to 0.4. Combined your down from 1.0 down to 0.8. Far better (60% more) than if you were all in domestic currency that had halved down to 0.5.
If the domestic currency doubles then 0.8 rises to 1.6 and 0.2 halves down to 0.1. Combined 1.7. Not as good (85%) as if you were all in domestic and seen 1.0 double to 2.0.
Across both, that compounds to 1.36 up, compared to 1.0 if you were all in domestic.
Another factor is that stocks dived near 90% that year. All in stock and being down to 10% of former value, when inflation was also running at 20% ... ouch! 20% in gold that had doubled in price/value, 0.2 to 0.4, when stocks had crashed down from 0.8 to 0.08, and the stock purchase power of gold at that time was massive. Rebalancing back to 80/20 would have had you expand the number of shares being held nearly five-fold. Whilst 2009 had a 80/20 stock/gold flat, from the start of 2010 onwards a reasonable stock stock recovery started and 80/20 recovered much quicker than all-stock.
Above chart is log scaled.
Gold prices : LBMA last 10am fix of each year used as the yearly gold gain/loss values. Respectively from December 2001 onward ..
4.3%
11.6%
10.0%
-3.1%
31.1%
8.9%
28.9%
42.7%
14.8%
32.8%
12.3%
0.9%
-29.4%
5.9%
-6.9%
31.6%
1.9%
4.6%
15.2%
-
torata
- Lemon Slice
- Posts: 523
- Joined: November 5th, 2016, 1:25 am
- Has thanked: 207 times
- Been thanked: 211 times
Re: HYP1 vs TJH HYP vs FTSE250 Review
IanTHughes wrote:Got it!
....
How did I miss that?
Ian
Don't beat yourself up about it. I'm sure no one else will.
As the sayings go: "Only Allah is perfect" and "Even monkeys fall from trees"
torata
-
Itsallaguess
- Lemon Half
- Posts: 9129
- Joined: November 4th, 2016, 1:16 pm
- Has thanked: 4140 times
- Been thanked: 10025 times
Re: HYP1 vs TJH HYP vs FTSE250 Review
1nvest wrote:
That's a really interesting chart.
Does it tell us anything regarding long-term market-participation itself being the single most important factor in delivering general investment-returns, rather than the specific strategy being used to carry out that participation?
Cheers,
Itsallaguess
-
Arborbridge
- The full Lemon
- Posts: 10439
- Joined: November 4th, 2016, 9:33 am
- Has thanked: 3644 times
- Been thanked: 5272 times
Re: HYP1 vs TJH HYP vs FTSE250 Review
1nvest wrote:
Nice piece of work - I know how long posts like those take!
I missed why you chose the FTSE250 - was that just a personal preference, because it seems to me that HYP was/is primarily based on teh FTSE100. The theory was that the biggest companies are less likely to fail, so we put a lower limit of variously just below the FTSE 100 smallest company or around some nominal value. (in the "old days" it would be about £1000k or £500k depending on preference). And it was this period that HYP1 and the TJH HYP evolved.
Most candidates would have been from the FTSE 100 not the 250.
Would it make much difference to your later conclusions? Possibly not, but it just seems the less obvious choice of index for comparison.
Arb.
-
1nvest
- Lemon Quarter
- Posts: 4414
- Joined: May 31st, 2019, 7:55 pm
- Has thanked: 691 times
- Been thanked: 1346 times
Re: HYP1 vs TJH HYP vs FTSE250 Review
Moving away from cap weighted is a tilt towards small(er). Commonly considered as higher risk/higher reward. HYP doesn't target reflecting market cap but instead opted to initial equal weight, and as such opted to tilt towards small. The FT250 is more reflective of a equal weighted set of smaller stocks. It's rare for instance for the largest holdings to be even 2% of the index weighting. When a holding does see its weighting relatively rise, more usually its ejected (into the FT100) and replaced with another stock that has a lower market cap value, a stock that is relatively down in price - similar to how a HYP might select a stock for its higher yield (and as yield and price are inverse functions is suggestive of lower price).
More a case of comparing factors (such as tilt towards small) rather than scale (level of market cap). In US scale for instance our FT100 large cap is US mid cap size scale, whilst our FT250 mid cap is more aligned with US small cap scale. Perhaps another candidate benchmark might be £ adjusted US midcap ... Hmm! Interesting idea/thought. Digging out data from portfoliovisualizer and £/$ data from the FRED
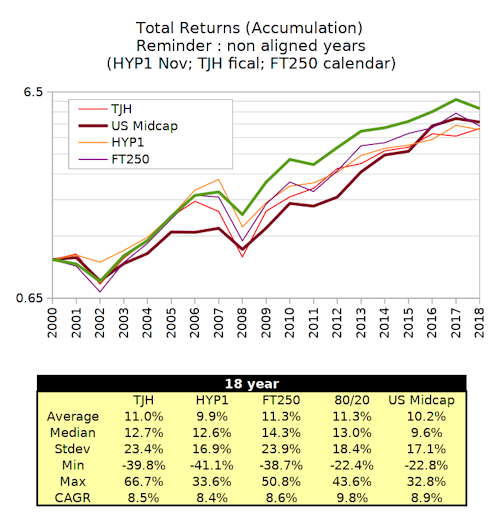
More a case of comparing factors (such as tilt towards small) rather than scale (level of market cap). In US scale for instance our FT100 large cap is US mid cap size scale, whilst our FT250 mid cap is more aligned with US small cap scale. Perhaps another candidate benchmark might be £ adjusted US midcap ... Hmm! Interesting idea/thought. Digging out data from portfoliovisualizer and £/$ data from the FRED
-
1nvest
- Lemon Quarter
- Posts: 4414
- Joined: May 31st, 2019, 7:55 pm
- Has thanked: 691 times
- Been thanked: 1346 times
Re: HYP1 vs TJH HYP vs FTSE250 Review
Looking at long term (140 year) yearly inflation and currency (£/$) deviations and the indications are for around a 1.25 factor difference and modest inverse correlation. Using that as a basis for how much foreign currency exposure to hold = 25% gold. Using US midcap as the stock holding and we can do a quick check using portfoliovisualizer US data https://tinyurl.com/yc2nmlck
That would have to be £ converted and adjusted against UK inflation, but looks to have been a reasonable choice of asset allocation. If HYP1/TJH/FT250 were similar to US midcap then so also might 75/25 of those have provided similar outcomes.
7.6% annualised real for a US investor (US inflation)
£ and UK inflation (RPI) adjusted it looks like 7.3% annualised real for 1972 to 2019 inclusive ...
That last row showing 2020 is for year to date, as at the end of June
UK real growth progression line looked like
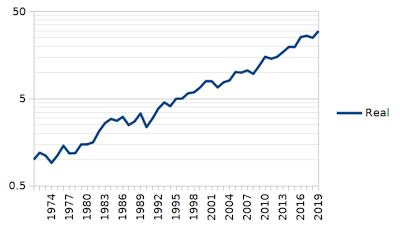
-
tjh290633
- Lemon Half
- Posts: 8271
- Joined: November 4th, 2016, 11:20 am
- Has thanked: 919 times
- Been thanked: 4131 times
Re: HYP1 vs TJH HYP vs FTSE250 Review
Arborbridge wrote:1nvest wrote:
Nice piece of work - I know how long posts like those take!
I missed why you chose the FTSE250 - was that just a personal preference, because it seems to me that HYP was/is primarily based on teh FTSE100. The theory was that the biggest companies are less likely to fail, so we put a lower limit of variously just below the FTSE 100 smallest company or around some nominal value. (in the "old days" it would be about £1000k or £500k depending on preference). And it was this period that HYP1 and the TJH HYP evolved.
Most candidates would have been from the FTSE 100 not the 250.
Would it make much difference to your later conclusions? Possibly not, but it just seems the less obvious choice of index for comparison.
Arb.
As I recall most of my choices were from the FTSE100, but I did venture some way into the FTSE250 when there was no suitable candidate in the main index. That's how I came to have Yule Catto (now Synthover) at one stage.
TJH
-
1nvest
- Lemon Quarter
- Posts: 4414
- Joined: May 31st, 2019, 7:55 pm
- Has thanked: 691 times
- Been thanked: 1346 times
Re: HYP1 vs TJH HYP vs FTSE250 Review
There is no equal sector weight index for the FT100 stock set, but Russell do record a equal weighted index. Again excluding the most recent year to avoid the Covid-19 distortions when using mis-aligned years ...

-
1nvest
- Lemon Quarter
- Posts: 4414
- Joined: May 31st, 2019, 7:55 pm
- Has thanked: 691 times
- Been thanked: 1346 times
Re: HYP1 vs TJH HYP vs FTSE250 Review
If you wanted to make rewards look relatively good, the MSCI World Index performed even worse than the FT100 (FT100 is perhaps more reflective of a global index tilt).
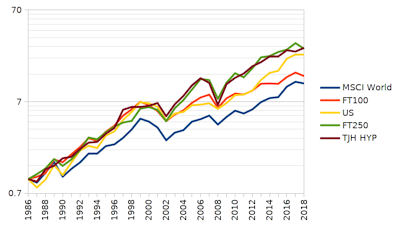
But that wont necessarily always be the case, things could swing around the other way over other periods. The US S&P500 index used to include foreign stocks, but that's been changed and some suggest that will see it tend to relatively lag compared to had it not been changed.
All very hit and miss. By luck pick the right index and great, pick the wrong one and Jack Bogle liked a similar idea to Pyad. Buy a diverse range of stocks in around equal capital weighting and just let that ride. Others validated that historically that broadly tended to relatively outperform the index but in the cases where it did fall short it only did so marginally (something like 0.6% lower annualised).
But that wont necessarily always be the case, things could swing around the other way over other periods. The US S&P500 index used to include foreign stocks, but that's been changed and some suggest that will see it tend to relatively lag compared to had it not been changed.
All very hit and miss. By luck pick the right index and great, pick the wrong one and
-
Arborbridge
- The full Lemon
- Posts: 10439
- Joined: November 4th, 2016, 9:33 am
- Has thanked: 3644 times
- Been thanked: 5272 times
Re: HYP1 vs TJH HYP vs FTSE250 Review
1nvest wrote:Moving away from cap weighted is a tilt towards small(er). Commonly considered as higher risk/higher reward. HYP doesn't target reflecting market cap but instead opted to initial equal weight, and as such opted to tilt towards small. The FT250 is more reflective of a equal weighted set of smaller stocks. It's rare for instance for the largest holdings to be even 2% of the index weighting. When a holding does see its weighting relatively rise, more usually its ejected (into the FT100) and replaced with another stock that has a lower market cap value, a stock that is relatively down in price - similar to how a HYP might select a stock for its higher yield (and as yield and price are inverse functions is suggestive of lower price).
Well, you may consider those good reasons for choosing the FTSE250, but that fact is that teh 250 was never the basis for HYP, so as a comparator for HYP1 it's the wrong index.
One of the guiding principles of HYP was to choose the largest companies in a sector which otherwise fulfilled the necessary criteria in the belief that these were more resilient in a downturn.
To pretend that wasn't so is to airbrush history.
Of course, we can all choose whatever benchmark we like, depending what we are trying to establish, but as regards HYP1 and TJH, there can be little doubt that the FTSE 250 is not the correct one. People should be aware of that. In the end it makes little diffference except informs one's own agenda.
Arb.
Return to “Portfolio Management & Review”
Who is online
Users browsing this forum: No registered users and 24 guests