tjh290633 wrote:1nvest wrote:Given your HYP is more equal weighted, less concentrated, the closer/better total return benchmark IMO is the FT250
The Ftse250 may be a closer match, but I only have a few from that group, plus one Small Cap - MARS.
It's the nominally equal weighting that produces the results.
Or rather its the equal weighting that reduces the potential cost of concentration risk. Concentration risk can sometimes reward, S&P500 of more recent as tech stocks have been relatively highly weighted as a sector and soared. But at other times costs, heavy into tech stocks across the dot com bubble bursting, financials across the 2008/9 financial crisis, Japan 1990's when relatively few grew to be massive and dominated the index such that even when those stocks faltered and halved/more they still remained dominant, dragging the whole index down and stay down type situation ...etc.
The FT250 feeds in and out of both the bottom/top, no one stock can become too dominant of the index. Those that soar are ejected out of the top, into the FT100, where later they might falter and drop back into the FT250 (or totally fail). Those in the FT250 that falter fall out of the bottom, maybe much of a single sector, replaced with fresher more upstarts that have better capacity (or less debts/negative-equity) to grow. Common in many ways to how you manage your TJH HYP but where dividend yield is used as the measure rather than capitalisation value.
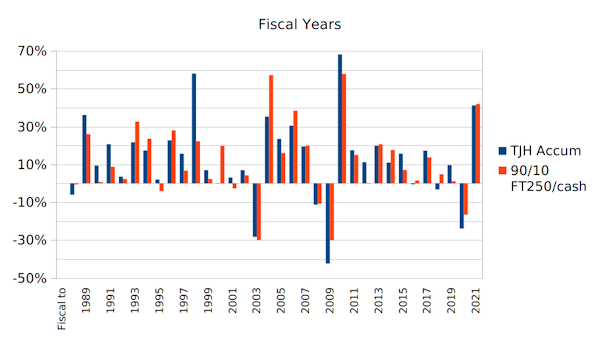
I find it interesting to see how two portfolios (TJH HYP and FTSE 250) have tended to compare over time. Suggestive its less a case of the actual stocks being held and rather the style (index methodology).
Last time I counted some time back the FTSE 250 comprised around 50 Investment Trusts holdings, so around 20% of its makeup/weighting.
Noteworthy is that for US stocks for where figures are more readily available I've noted $40T stock market cap versus $10Tn Corporate Bond market cap. Stocks borrow (short bonds) in around 80/20 stock/bond proportions. Investors who buy those corporate bonds as well as stocks in around 80/20 proportions in effect negate the leverage (borrowing to invest) are in effect both borrowing and lending from/to themselves. Whilst that seems unproductive leveraging just broadly scales volatility, not rewards. Leveraged holdings will tend to zigzag around the non-leveraged. So still broadly the same reward, but with less volatility, not actually a unproductive use of capital.
Corporate bonds yield more, but have higher default risk, broadly washes, so what Buffett does is shift the corporate bond risk over to the stock side, holds 90/10 stock/T-Bills instead of 80/20 stock/corporate bonds.
10% in 'cash' caters for unexpected spending when stocks may be down.
For much of time 100/0 will pull ahead (Bull periods, that are more common), periodically after pull-backs that can see
100/0 realign with 90/10, even after decades had passed. At which times you could opt to dump the cash into the market and thereafter continue to compare to 100/0, as though you'd been 100/0 throughout, but having had the added benefit of 'emergency reserves' (10% cash) that you could 'borrow' at any time (or perhaps totally spend and replace from selling some shares at a time when it looked reasonable to do so (relative high)).
I find your portfolio management and record keeping most admirable Terry, I'd be hard pressed to achieve similar myself, let alone other family members stepping up to that task if/when so needed. A simpler alternative is more preferable for me/heirs and the FTSE 250 seems to fit that bill. I've been tracking the comparisons for years now and as each year passes continue to remain comfortable of the comparisons/alignment, even if in the more broader sense (deviations in years can be evident as the above chart indicates).
Thanks.