Donate to Remove ads

Got a credit card? use our Credit Card & Finance Calculators

Thanks to eyeball08,Wondergirly,bofh,johnstevens77,Bhoddhisatva, for Donating to support the site

Useful discussion on measuring portfolio growth rates

A helpful place to also put any annual reports etc, of your own portfolios
MDW1954
Lemon Quarter
Posts: 2361
Joined: November 4th, 2016, 8:46 pm
Has thanked: 527 times
Been thanked: 1011 times

Re: Useful discussion on measuring portfolio growth rates

#497254

Postby MDW1954 » April 28th, 2022, 2:43 pm

Hariseldon58 wrote:
The problem with the CAGR is that you basically start at the beginning and look at the result at the end and calculate the number, but change the start and finish dates slightly and despite a long time period the numbers can move around a lot… it may not help you to compare with other investment possibilities, unless you are very careful in your comparison or to have a feeling for what may come next.


This of course is one of the advantages of logarithmic linear least squares, which I referred to in an earlier post. It uses all the data points, not just two, and calculates a regression line through them, the slope of which is the growth rate.

MDW1954

Newroad
Lemon Quarter
Posts: 1095
Joined: November 23rd, 2019, 4:59 pm
Has thanked: 17 times
Been thanked: 343 times

Re: Useful discussion on measuring portfolio growth rates

#497261

Postby Newroad » April 28th, 2022, 2:59 pm

Hi All,

Terry's unitised accumulation unit data was only the starting point/input.

The two main questions, to my mind, were

    1. Why did I get an XIRR of 10.555% and Terry/Doug 9.55% using the same data?
    2. If Terry/Doug's figure is the accurate one, why is it materially different from the c10.545% I calibrated for the CAGR/Geometric Mean return using the same/similar data, when one would have expected it to be almost the same?

Later on, there was a tangential discussion re unitising techniques, but I'm not sure it's germane to the above questions.

Regards, Newroad

MDW1954
Lemon Quarter
Posts: 2361
Joined: November 4th, 2016, 8:46 pm
Has thanked: 527 times
Been thanked: 1011 times

Re: Useful discussion on measuring portfolio growth rates

#497275

Postby MDW1954 » April 28th, 2022, 3:38 pm

Newroad wrote:Hi All,

Terry's unitised accumulation unit data was only the starting point/input.

The two main questions, to my mind, were

    1. Why did I get an XIRR of 10.555% and Terry/Doug 9.55% using the same data?
    2. If Terry/Doug's figure is the accurate one, why is it materially different from the c10.545% I calibrated for the CAGR/Geometric Mean return using the same/similar data, when one would have expected it to be almost the same?

Later on, there was a tangential discussion re unitising techniques, but I'm not sure it's germane to the above questions.

Regards, Newroad


I think my take would be that Terry's revised XIRR/ IRR column gives a final return of 10.64%, whereas as CAGR/ geometric mean gives 10.545%. That's a fairly small discrepency, and XIRR/ IRR is in any case a different measurement technique. Given that (as I understand it), Terry is cumulatively re-calculating it for each of those 35 years, the difference could conceivably be repeated rounding error. Beyond that, I don't know.

MDW1954

Newroad
Lemon Quarter
Posts: 1095
Joined: November 23rd, 2019, 4:59 pm
Has thanked: 17 times
Been thanked: 343 times

Re: Useful discussion on measuring portfolio growth rates

#497279

Postby Newroad » April 28th, 2022, 3:44 pm

That's completely fine, MDW.

Indeed, the 21 day start date discrepancy might explain the small difference.

But both Doug and if I recall correctly, Terry, have instead cited 9.55% XIRR's.

Regards, Newroad

tjh290633
Lemon Half
Posts: 8266
Joined: November 4th, 2016, 11:20 am
Has thanked: 918 times
Been thanked: 4130 times

Re: Useful discussion on measuring portfolio growth rates

#497306

Postby tjh290633 » April 28th, 2022, 5:34 pm

MDW1954 wrote:I think my take would be that Terry's revised XIRR/ IRR column gives a final return of 10.64%, whereas as CAGR/ geometric mean gives 10.545%. That's a fairly small discrepency, and XIRR/ IRR is in any case a different measurement technique. Given that (as I understand it), Terry is cumulatively re-calculating it for each of those 35 years, the difference could conceivably be repeated rounding error. Beyond that, I don't know.

MDW1954

I am not calculating it for each year, but for the period since inception. I also have results for each year, which shows rises and falls, as you can see from the values of the accumulation units.

TJH

MDW1954
Lemon Quarter
Posts: 2361
Joined: November 4th, 2016, 8:46 pm
Has thanked: 527 times
Been thanked: 1011 times

Re: Useful discussion on measuring portfolio growth rates

#497322

Postby MDW1954 » April 28th, 2022, 6:13 pm

Newroad wrote:That's completely fine, MDW.

But both Doug and if I recall correctly, Terry, have instead cited 9.55% XIRR's.

Regards, Newroad


Did Terry not revise that, today, to 10.64%?

MDW1954

MDW1954
Lemon Quarter
Posts: 2361
Joined: November 4th, 2016, 8:46 pm
Has thanked: 527 times
Been thanked: 1011 times

Re: Useful discussion on measuring portfolio growth rates

#497324

Postby MDW1954 » April 28th, 2022, 6:15 pm

tjh290633 wrote:
MDW1954 wrote:I think my take would be that Terry's revised XIRR/ IRR column gives a final return of 10.64%, whereas as CAGR/ geometric mean gives 10.545%. That's a fairly small discrepency, and XIRR/ IRR is in any case a different measurement technique. Given that (as I understand it), Terry is cumulatively re-calculating it for each of those 35 years, the difference could conceivably be repeated rounding error. Beyond that, I don't know.

MDW1954

I am not calculating it for each year, but for the period since inception. I also have results for each year, which shows rises and falls, as you can see from the values of the accumulation units.

TJH


Sorry Terry: sloppy phraseology on my part. What I mean is that each additional year, you recalculate the IRR for the period since inception, and that this is what the figures in the IRR column represent.

Am I understanding it correctly?

MDW1954

Bagger46

Re: Useful discussion on measuring portfolio growth rates

#497326

Postby Bagger46 » April 28th, 2022, 6:47 pm

tjh290633 wrote:The corrected version of my earlier post, viewtopic.php?p=496991#p496991 is:

The rate of return for my accumulation units for the 35 periods, each starting on 21 Apr 1987 and finishing on the date shown, is as follows:

Year End    Acc Unit   IRR from start
to year end
21-Apr-87 1.00
20-Apr-88 0.92 -8.00%
16-Apr-89 1.24 11.42%
11-Apr-90 1.39 11.70%
28-Mar-91 1.69 14.26%
28-Mar-92 1.75 12.00%
27-Mar-93 2.13 13.58%
22-Mar-94 2.50 14.15%
26-Mar-95 2.55 12.52%
01-Apr-96 3.13 13.59%
28-Mar-97 3.62 13.81%
28-Mar-98 5.72 17.28%
31-Mar-99 6.12 16.37%
31-Mar-00 6.13 15.02%
31-Mar-01 6.32 14.13%
31-Mar-02 6.76 13.63%
31-Mar-03 4.85 10.40%
31-Mar-04 6.56 11.73%
31-Mar-05 8.10 12.36%
01-Apr-06 10.57 13.24%
31-Mar-07 13.20 13.80%
31-Mar-08 11.21 12.22%
31-Mar-09 6.46 8.87%
31-Mar-10 10.86 10.95%
31-Mar-11 12.76 11.21%
30-Mar-12 14.19 11.21%
28-Mar-13 17.41 11.64%
31-Mar-14 18.88 11.51%
31-Mar-15 21.84 11.66%
31-Mar-16 21.91 11.25%
31-Mar-17 25.47 11.41%
30-Mar-18 24.66 10.91%
31-Mar-19 26.64 10.81%
31-Mar-20 21.64 9.77%
31-Mar-21 29.07 10.43%
31-Mar-22 33.41 10.64%

This accounts for much of the discussion above.

TJH


Two comments if I may:

First I wish you did not persist in calling the second column IRR. You clearly used the XIRR formula to calculate it, but for data pairs what you are calculating is actually the CAGR of your acc units from inception to those dates( It is special case of the use of the XIRR formula which is perfectly valid in this case, but what is calculated is a CAGR). I have reproduced your data extremely closely using the more usual EXP(LN(b/a)/duration in years including any fraction)-1 mathematical formulae, or ratio^(1/duration)-1 if you prefer. I think I remember my late father-in-law posting you on that very thing which you decided to ignore years ago. But bear in mind that we both studied maths to post doc research standards. Most probably well into what our late Geng would have come up with too.

Secondly your last figure is wrong, check it, it should be 10.56% by all methods I use, including your own.

Regards

Bagger

PS

=EXP(LN(F48/$F$47)/((E48-$E$47)/365.25))-1 a typical formula in my spreadsheet for your info.

tjh290633
Lemon Half
Posts: 8266
Joined: November 4th, 2016, 11:20 am
Has thanked: 918 times
Been thanked: 4130 times

Re: Useful discussion on measuring portfolio growth rates

#497335

Postby tjh290633 » April 28th, 2022, 7:46 pm

MDW1954 wrote:
tjh290633 wrote:
MDW1954 wrote:I think my take would be that Terry's revised XIRR/ IRR column gives a final return of 10.64%, whereas as CAGR/ geometric mean gives 10.545%. That's a fairly small discrepency, and XIRR/ IRR is in any case a different measurement technique. Given that (as I understand it), Terry is cumulatively re-calculating it for each of those 35 years, the difference could conceivably be repeated rounding error. Beyond that, I don't know.

MDW1954

I am not calculating it for each year, but for the period since inception. I also have results for each year, which shows rises and falls, as you can see from the values of the accumulation units.

TJH


Sorry Terry: sloppy phraseology on my part. What I mean is that each additional year, you recalculate the IRR for the period since inception, and that this is what the figures in the IRR column represent.

Am I understanding it correctly?

MDW1954

Yes you are.

TJH

tjh290633
Lemon Half
Posts: 8266
Joined: November 4th, 2016, 11:20 am
Has thanked: 918 times
Been thanked: 4130 times

Re: Useful discussion on measuring portfolio growth rates

#497336

Postby tjh290633 » April 28th, 2022, 7:52 pm

Bagger46 wrote:Two comments if I may:

First I wish you did not persist in calling the second column IRR. You clearly used the XIRR formula to calculate it, but for data pairs what you are calculating is actually the CAGR of your acc units from inception to those dates( It is special case of the use of the XIRR formula which is perfectly valid in this case, but what is calculated is a CAGR). I have reproduced your data extremely closely using the more usual EXP(LN(b/a)/duration in years including any fraction)-1 mathematical formulae, or ratio^(1/duration)-1 if you prefer. I think I remember my late father-in-law posting you on that very thing which you decided to ignore years ago. But bear in mind that we both studied maths to post doc research standards. Most probably well into what our late Geng would have come up with too.

Secondly your last figure is wrong, check it, it should be 10.56% by all methods I use, including your own.

Regards

Bagger

PS

=EXP(LN(F48/$F$47)/((E48-$E$47)/365.25))-1 a typical formula in my spreadsheet for your info.

You are correct. I had forgotten to change the number in my final calculation. It is 10.56%.

Thanks for pointing that out.

TJH (Whose maths finished at Higher School Certificate)

MDW1954
Lemon Quarter
Posts: 2361
Joined: November 4th, 2016, 8:46 pm
Has thanked: 527 times
Been thanked: 1011 times

Re: Useful discussion on measuring portfolio growth rates

#497356

Postby MDW1954 » April 28th, 2022, 8:50 pm

Bagger46 wrote:I have reproduced your data extremely closely using the more usual EXP(LN(b/a)/duration in years including any fraction)-1 mathematical formulae, or ratio^(1/duration)-1 if you prefer.

Regards

Bagger

PS

=EXP(LN(F48/$F$47)/((E48-$E$47)/365.25))-1 a typical formula in my spreadsheet for your info.


That's a very handy formula, Bagger. Thank you. And thank you also for reminding me of OZYU.

MDW1954

Newroad
Lemon Quarter
Posts: 1095
Joined: November 23rd, 2019, 4:59 pm
Has thanked: 17 times
Been thanked: 343 times

Re: Useful discussion on measuring portfolio growth rates

#497370

Postby Newroad » April 28th, 2022, 9:56 pm

Thanks to all who have contributed.

So, I'm now happy that my calibrated 10.545% was close enough (perhaps even right, to 3 decimal places) and any residual discrepancy, if any, is likely down to the 21 day variation in start date.

Doug may still have some questions on Accumulation Unit methodology - I'll defer to him if so.

Regards, Newroad

Bagger46

Re: Useful discussion on measuring portfolio growth rates

#497373

Postby Bagger46 » April 28th, 2022, 10:16 pm

Newroad wrote:Thanks to all who have contributed.

So, I'm now happy that my calibrated 10.545% was close enough (perhaps even right, to 3 decimal places) and any residual discrepancy, if any, is likely down to the 21 day variation in start date.

Doug may still have some questions on Accumulation Unit methodology - I'll defer to him if so.

Regards, Newroad


Doug and I will do this by PM off board, since it is not germane to the thread. We have communicated.

Bagger

MDW1954
Lemon Quarter
Posts: 2361
Joined: November 4th, 2016, 8:46 pm
Has thanked: 527 times
Been thanked: 1011 times

Re: Useful discussion on measuring portfolio growth rates

#497379

Postby MDW1954 » April 28th, 2022, 10:47 pm

Bagger46 wrote:
Newroad wrote:Thanks to all who have contributed.

So, I'm now happy that my calibrated 10.545% was close enough (perhaps even right, to 3 decimal places) and any residual discrepancy, if any, is likely down to the 21 day variation in start date.

Doug may still have some questions on Accumulation Unit methodology - I'll defer to him if so.

Regards, Newroad


Doug and I will do this by PM off board, since it is not germane to the thread. We have communicated.

Bagger


I would be interested in the conclusion. Are you aware of Gengulphus' "sticky" post on the HYP-P board? Is there anything there that you would suggest doing differently?

If so, I'm all ears.

MDW1954

1nvest
Lemon Quarter
Posts: 4401
Joined: May 31st, 2019, 7:55 pm
Has thanked: 690 times
Been thanked: 1342 times

Re: Useful discussion on measuring portfolio growth rates

#579821

Postby 1nvest » March 31st, 2023, 2:30 pm

TJH Accumulation HYP series ...

Code: Select all

1
0.92
1.24
1.39
1.69
1.75
2.13
2.5
2.55
3.13
3.62
5.72
6.12
6.13
6.32
6.76
4.85
6.56
8.1
10.57
13.2
11.21
6.46
10.86
12.76
14.19
17.41
18.88
21.84
21.91
25.47
24.66
26.64
21.64
29.07
33.41

loaded into a spreadsheet column A rows 1 - 36

CAGR =RRI(count(A2:A36),A1,A36) = 10.545%
or =(A36^(1/count(A2:A36)))-1 = 10.545%

or calculate the yearly changes, and then the average of those changes, and the standard deviation
=(average(B2:b36) = 12.64779148623
and =stdev(b2:b36) = 21.3317856716772
and near the bottom of https://www.gummystuff.org/AM-vs-GM.htm there's a tool to approximate the CAGR from those average and standard deviation values = 10.6%
Image
(Whilst you're there, Gummy (Peter Ponzo) produced a load of other mathematical and other stuff about investing https://www.gummystuff.org/ along with many spreadsheets. He was a great guy, very helpful and pleasant (never met in person) but sadly he passed away in early July 2020 after a battle with bone cancer).

Like MDW1954 however and I prefer log linear
=linest(ln(a1:a36)) = 9.8366449618399%

in effect the exponential series (so generally more straight lined when plotted for many years of gains) trend line, which eliminates/reduces start and end date variance, that might swing CAGR around +/- 1% or more in some cases.

For a simple risk-reward measure comparison I sometimes just divide the annualised (CAGR) or log linear by the standard deviation, where when comparing two series the one with higher value is the 'better' risk adjusted reward.

Or you might use the r-squared value of the series instead of the stdev as the divisor as the r-squared is a indicator of how much the actual varied around the 'trend line'. I don't have a 'in head' formula for calculating r-squared so I tend to just plot the chart, making the Y-axis log scaled, and then add a trendline to that, selecting the 'exponential' choice and opting to add the r-squared value

No where as educated as other posters hereabouts (left school at 15), just what I commonly use when comparing portfolios such as FTSE250 vs HYP1 total returns
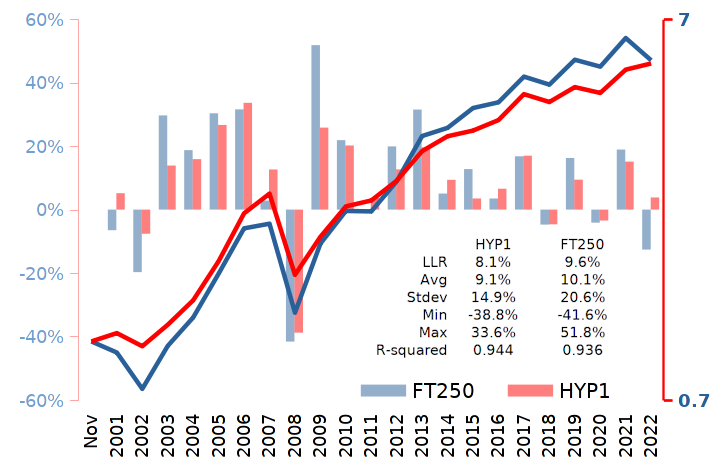
Image
in post viewtopic.php?p=579724#p579724

or
FTSE250 and TJH respective figures for total returns spanning fiscal years April 1987 - April 2023

Log linear regression 10% 9.9%
Average 12.3% 12.4%
Stdev 22.2% 20.2%
Min -33.9% -42.4%
Max 64.2% 68.1%
R-squared 0.973 0.961

in post viewtopic.php?p=579681#p579681

XFool
The full Lemon
Posts: 12636
Joined: November 8th, 2016, 7:21 pm
Been thanked: 2608 times

Re: Useful discussion on measuring portfolio growth rates

#579828

Postby XFool » March 31st, 2023, 3:08 pm

1nvest wrote:(Whilst you're there, Gummy (Peter Ponzo) produced a load of other mathematical and other stuff about investing https://www.gummystuff.org/ along with many spreadsheets. He was a great guy, very helpful and pleasant (never met in person) but sadly he passed away in early July 2020 after a battle with bone cancer).

Another fan of Gummy Stuff. :)


Return to “Portfolio Management & Review”

Who is online

Users browsing this forum: No registered users and 56 guests