TJH Accumulation HYP series ...
Code: Select all
1
0.92
1.24
1.39
1.69
1.75
2.13
2.5
2.55
3.13
3.62
5.72
6.12
6.13
6.32
6.76
4.85
6.56
8.1
10.57
13.2
11.21
6.46
10.86
12.76
14.19
17.41
18.88
21.84
21.91
25.47
24.66
26.64
21.64
29.07
33.41
loaded into a spreadsheet column A rows 1 - 36
CAGR
=RRI(count(A2:A36),A1,A36) = 10.545%
or
=(A36^(1/count(A2:A36)))-1 = 10.545%
or calculate the yearly changes, and then the average of those changes, and the standard deviation
=(average(B2:b36) = 12.64779148623
and
=stdev(b2:b36) = 21.3317856716772
and near the bottom of
https://www.gummystuff.org/AM-vs-GM.htm there's a tool to approximate the CAGR from those average and standard deviation values = 10.6%
(Whilst you're there, Gummy (Peter Ponzo) produced a load of other mathematical and other stuff about investing
https://www.gummystuff.org/ along with many spreadsheets. He was a great guy, very helpful and pleasant (never met in person) but sadly he passed away in early July 2020 after a battle with bone cancer).
Like MDW1954 however and I prefer log linear
=linest(ln(a1:a36)) = 9.8366449618399%
in effect the exponential series (so generally more straight lined when plotted for many years of gains) trend line, which eliminates/reduces start and end date variance, that might swing CAGR around +/- 1% or more in some cases.
For a simple risk-reward measure comparison I sometimes just divide the annualised (CAGR) or log linear by the standard deviation, where when comparing two series the one with higher value is the 'better' risk adjusted reward.
Or you might use the r-squared value of the series instead of the stdev as the divisor as the r-squared is a indicator of how much the actual varied around the 'trend line'. I don't have a 'in head' formula for calculating r-squared so I tend to just plot the chart, making the Y-axis log scaled, and then add a trendline to that, selecting the 'exponential' choice and opting to add the r-squared value
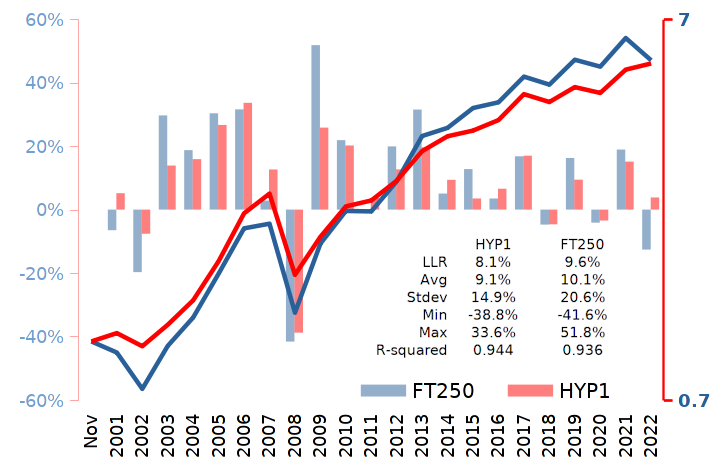
No where as educated as other posters hereabouts (left school at 15), just what I commonly use when comparing portfolios such as FTSE250 vs HYP1 total returns
in post
viewtopic.php?p=579724#p579724 or
FTSE250 and TJH respective figures for total returns spanning fiscal years April 1987 - April 2023
Log linear regression 10% 9.9%
Average 12.3% 12.4%
Stdev 22.2% 20.2%
Min -33.9% -42.4%
Max 64.2% 68.1%
R-squared 0.973 0.961
in post
viewtopic.php?p=579681#p579681