Donate to Remove ads

Got a credit card? use our Credit Card & Finance Calculators

Thanks to gpadsa,Steffers0,lansdown,Wasron,jfgw, for Donating to support the site

monabri's portfolio

A helpful place to also put any annual reports etc, of your own portfolios
monabri
Lemon Half
Posts: 8443
Joined: January 7th, 2017, 9:56 am
Has thanked: 1551 times
Been thanked: 3450 times

monabri's portfolio

#558224

Postby monabri » December 31st, 2022, 4:42 pm

Portfolio Overview.

Image

The portfolio is predominately biased towards "income", comprising Investment Trusts 32%, HYP shares 47% and a small holding in Prefs and Bonds. at 3%. The Pickering rule of "ish" applies. ;)

Total Return This Year

All dividends are being reinvested.

Image

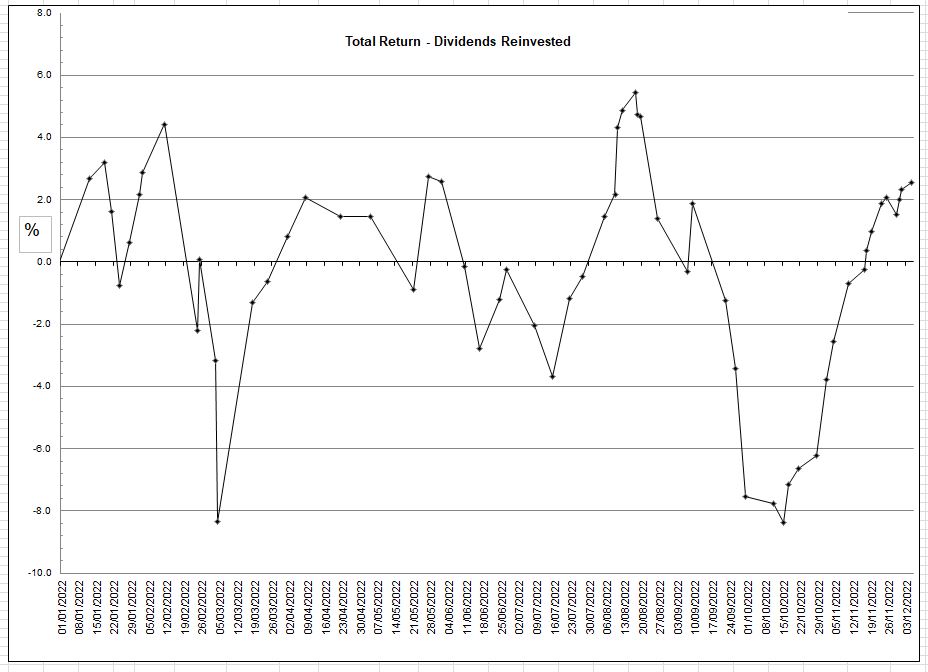
It looks roller coaster-ish but the variation is +/- 8% max.

Whilst the total return (TR) has been overall slightly positive at +1.7% as measured from the end of 2022 one notes that the TR includes a chunk of dividends.If I were to strip out the dividends received, the TR would be -4.4%.

Performance Since Inception

Image

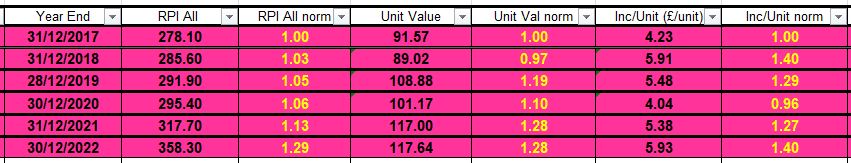
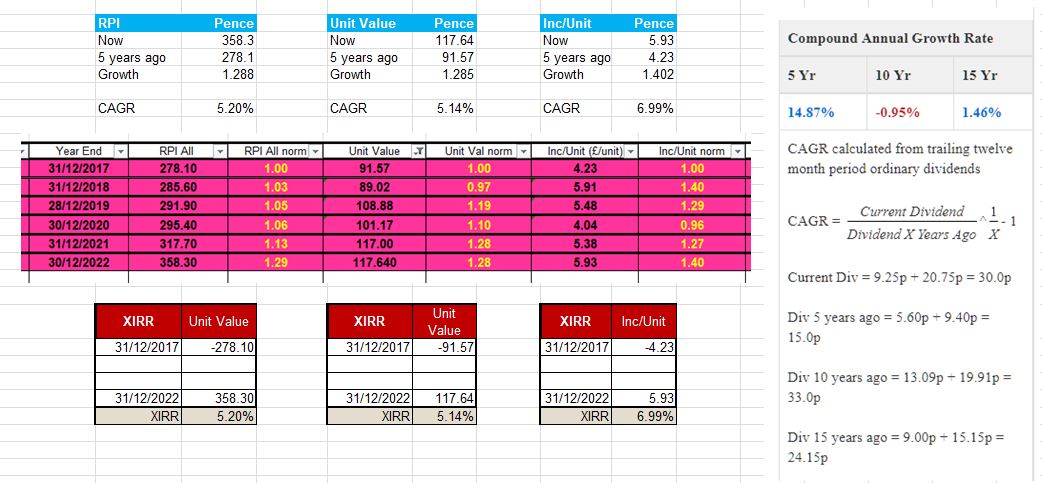
I'm using RPI All items as a measure. I noted the RPI index and have normalised the values. The final RPI all items for Dec 2022 is not stated yet so I've gone with November's figure.

The unit value is ~keeping pace with RPI All Index...more or less.

More pleasing is the progression in dividends as measured by income per unit which seems (fingers crossed) to have shaken off the Covid blues when a lot of dividends were culled/held back/stopped etc. I am predicting a possible (small) reduction in dividends (amount received) for 2023 but who knows (I've zeroed out Specials for things like ADM, BHP & RIO and thus one might expect these big hitters might play a part in dragging overall income down despite hoped for increases in ordinary dividends.

monabri
Lemon Half
Posts: 8443
Joined: January 7th, 2017, 9:56 am
Has thanked: 1551 times
Been thanked: 3450 times

Re: monabri's portfolio

#558249

Postby monabri » December 31st, 2022, 6:55 pm

I'm not exactly sure if the following analysis is correct.... ( :oops: ) but I'm restating the results in terms of both XIRR and CAGR (with an explanation of the calculation method purloined from dividend data over on the RHS of the page which I think I "borrowed" from the CAGR calc for WPP! - To be clear, where it says "CAGR = current dividend/ Dividend X years ago etc" is the method I'm using and does not relate to my figures presented here).

I've rounded the calcs to 2dp. If one were to click on the tables in the spreadsheet, there are very small differences (nuggatory) between the XIRR and CAGR calcs.

Image


The predominant porfolio bias to "income" income per unit (inc/unit) appears to be evident. The growthy elements (unit value) is increasing at a lower rate.


Return to “Portfolio Management & Review”

Who is online

Users browsing this forum: No registered users and 13 guests