tjh290633 wrote:1nvest wrote: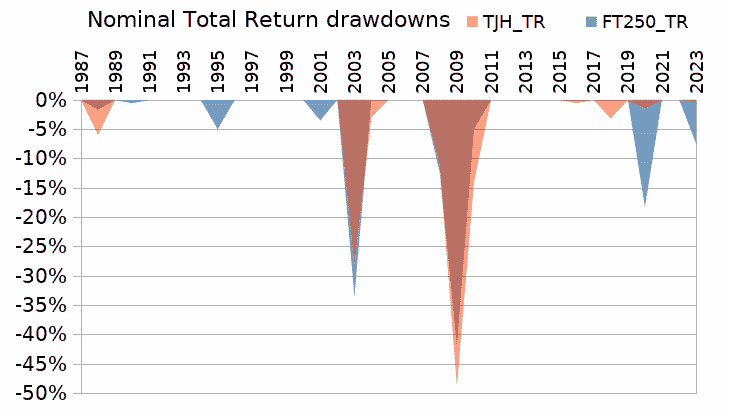
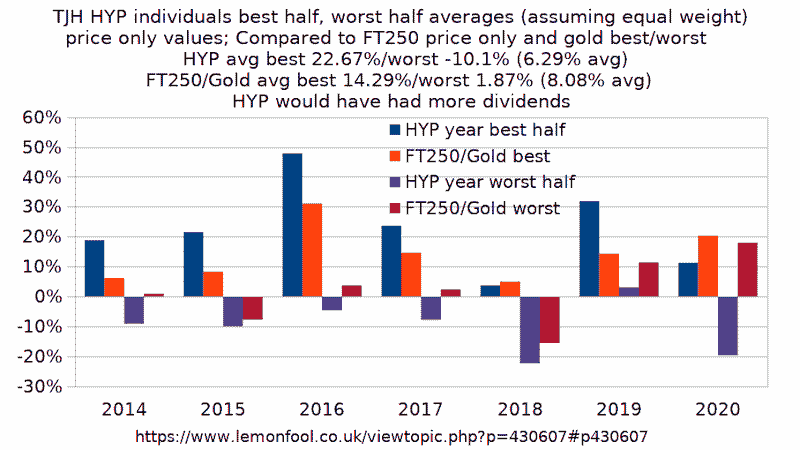
Thanks for an interesting comparison. As stated above, I think that the apparent alignment with the FTSE250 is coincidental, probably because of my nominally equal weighted approach.
TJH
The FTSE250 is more equal weight rare for a single stock to rise to being even >1.5% of the total index weighting (in contrast the FTSE100 can at times have 10% in single stocks and sometimes relatively high individual weightings in a bunch of stocks within the same sector (sector concentration/tilting)). Large/rising stocks migrate into the FTSE100, which might be considered a form of 'top-slicing' winners. Faltering/down stocks in the FTSE100 that haven't totally failed drop down into the FTSE250, 'value' plays, might continue to decline, could rebound and return back into the FTSE100; As a alternative to 'value' plays in the way of being measured by dividend yield. At the bottom end faltering smaller caps are ejected, replaced with rising alternatives, potential future 'value' plays that in some cases might see them rise all the way through and out into the FTSE100.
Has many similarities to your 'tweaked HYP' IMO, whilst the historic actual total returns somewhat compare in confirmation of that.
Also include a bunch of Investment Trusts, haven't looked recently, but IIRC something like 40 of the 250 total stocks being IT's, so a 16% type weighting assuming equal value (which they're not, so just a rough guide).
Whilst there were no retail options for FTSE250 exposure back in the late 1980's, as the index wasn't even created until the early 1990's, they did back calculate the FTSE250 index to 1986.
End of Dec 1985 month end total return index values up to end of March 2023
Code: Select all
363.2
373.9
407.5
439.8
456.4
442.4
463.0
443.2
463.6
439.3
463.5
477.1
483.8
531.3
569.0
587.7
597.3
635.9
691.3
734.6
702.7
750.1
536.9
481.4
543.7
581.5
582.5
577.7
602.3
606.8
637.5
646.8
608.6
633.3
657.3
636.2
625.8
710.4
721.5
739.6
736.7
747.7
743.7
795.9
804.9
794.5
725.8
755.4
793.2
775.8
740.5
735.3
692.9
756.1
774.4
759.1
672.5
609.1
640.6
656.3
665.6
658.9
757.4
795.2
795.4
784.9
761.7
804.6
840.5
851.7
833.6
786.0
781.3
821.5
840.4
805.2
910.3
936.0
861.8
781.8
748.0
821.3
867.4
910.7
992.1
1027.6
1059.5
1088.3
1100.6
1116.2
1144.9
1174.0
1251.0
1227.2
1265.3
1254.1
1368.8
1478.9
1438.2
1367.2
1381.7
1306.6
1255.6
1342.8
1411.9
1296.8
1308.9
1305.5
1311.0
1265.7
1274.8
1297.9
1338.2
1389.2
1370.3
1463.7
1501.6
1519.7
1503.4
1533.1
1562.0
1607.1
1647.1
1695.7
1788.9
1777.5
1720.8
1677.5
1756.3
1751.5
1769.4
1777.1
1807.4
1855.1
1884.5
1858.4
1832.6
1837.1
1816.5
1847.3
1899.0
1998.4
1927.2
1938.9
1999.6
2036.5
2184.7
2326.7
2368.3
2496.5
2333.6
2329.9
2039.0
1940.9
2059.8
2103.1
2087.4
2165.0
2266.4
2369.4
2536.6
2450.6
2551.3
2605.5
2632.4
2493.7
2471.5
2729.5
2846.2
2736.1
2862.1
2879.0
2760.5
2781.4
2954.2
3040.0
3170.9
3005.7
2990.0
2901.3
2964.7
3055.7
3022.3
2776.0
2925.2
3005.0
2886.6
2793.4
2815.2
2362.2
2482.1
2712.8
2760.7
2725.3
2724.6
2890.3
2872.3
2843.5
2589.9
2260.1
2301.6
2036.8
2104.8
2177.6
2069.3
1930.2
1946.5
1915.3
2129.5
2342.9
2421.6
2605.2
2743.1
2683.9
2822.4
2824.0
2876.0
2993.6
3123.6
3126.1
3109.7
3038.9
3159.4
3039.4
3079.7
3179.7
3214.6
3352.8
3544.2
3669.9
3723.5
3668.9
3471.3
3679.3
3820.2
3952.4
4037.1
4152.2
4037.1
4370.4
4625.7
4835.4
4991.6
5214.9
5241.0
4944.2
5021.7
4997.3
5140.1
5363.5
5576.7
5750.9
6034.4
6004.4
6006.6
6346.7
6488.3
6598.2
6291.1
6197.9
6192.8
6054.2
6408.9
5914.8
5874.3
5456.5
5569.5
5549.9
5621.5
5592.4
5101.4
4952.4
5258.6
4434.5
3545.3
3452.4
3618.3
3569.7
3468.4
3668.2
4346.4
4384.3
4306.1
4658.7
5147.2
5348.9
5210.7
5241.5
5481.1
5451.6
5526.4
6023.6
6154.4
5733.6
5584.4
5944.0
5882.5
6318.0
6517.6
6388.6
6974.2
6934.6
7038.5
7034.4
7304.4
7347.1
7284.3
7065.9
6453.2
6035.4
6456.8
6371.4
6256.4
6685.3
7123.6
7195.4
7135.9
6614.9
6865.2
7009.8
7198.0
7418.3
7561.4
7640.2
7872.6
8305.9
8751.7
8908.5
8942.8
9217.4
8880.1
9589.8
9448.5
9649.9
10039.0
10049.6
10373.7
10223.8
10930.0
10655.1
10377.2
10525.2
10358.5
10230.5
10510.5
10198.7
10302.6
10559.1
10738.8
10910.1
11582.1
11483.8
11766.3
12248.8
11853.3
11976.9
11615.1
11352.8
11673.7
11906.1
11937.9
11318.6
11423.9
11672.5
11613.3
11905.0
11299.3
12029.3
12370.2
12494.9
12294.4
12323.9
12726.0
12804.8
13273.8
13445.8
13932.0
14215.9
13796.9
14142.6
14190.2
14273.1
14558.8
14393.4
14984.2
14668.4
14298.8
14167.9
14802.4
15246.4
15269.9
15339.4
15236.0
14990.4
14000.8
13713.9
13024.2
13961.5
14349.3
14339.2
14907.8
14303.7
14713.3
14907.0
14739.6
15192.2
15297.1
15942.0
16803.2
16275.2
14919.4
11693.5
12779.4
13273.6
13369.3
13259.2
13964.0
13626.7
13580.5
15286.9
16229.2
16055.0
16627.4
17142.4
17953.1
18133.0
17917.6
18407.0
19362.7
18532.8
18623.7
18180.8
18986.7
17761.0
17108.0
17205.0
16871.9
16669.8
15275.9
16534.0
15673.4
14154.0
14788.7
15882.3
15667.0
16558.5
16627.3
15896.6
See also
https://uk.investing.com/indices/ftse-2 ... rical-dataNot perfectly aligned values as my accumulation total return index value dating back to Dec 1985 had monthly % changes applied. Generally that washes out, is close enough (better than nowt).
More than just being a coincidental comparison IMO. A better 'benchmark'.