Re: measurement of risk
Posted: December 20th, 2023, 4:07 pm
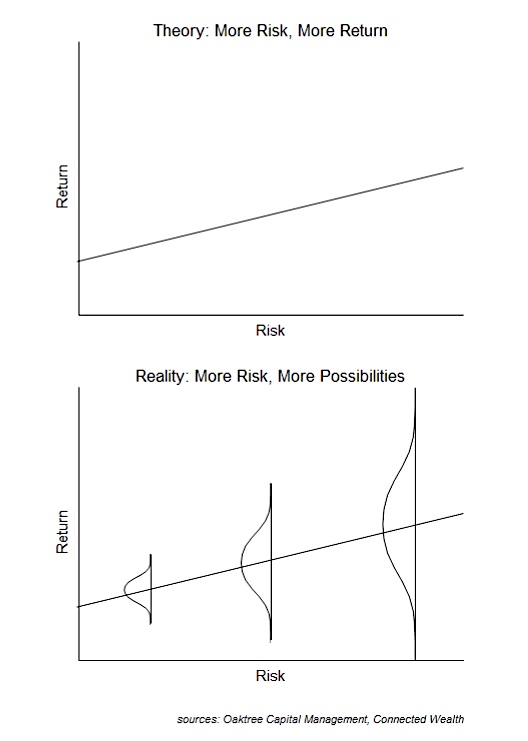
what people think risk vs reward means, and what it really means:
Shares, Investment and Personal Finance Discussion Forums
https://www.lemonfool.co.uk/
Whatsitworth wrote:The volatility of a companies stock price has no bearing on the risk to the investor. Business risk is what you should be concerned with. Risks to the business can be valued/measured.
.GeoffF100 wrote:No. The volatility of cash earning a fixed rate of interest is zero. Here is the correct calculation for volatility:
https://www.macroption.com/historical-volatility-excel/
Suppose cash earns 5% p.a. First we need to calculate Ri = ln (Ci / Ci-1). (The i and i-1 are subscripts.) This will be the same every day.
Ci / Ci-1 = 1.05^(1/364)
Ri = ln(1.05^(1/364))
The standard deviation of Ri over any time period is zero. As I have said, yearly prices are not good enough. You can get daily prices from Yahoo and other sources. The free sources tend to contain "noise" though, i.e. daily movements that did not occur in the real market.
Bubblesofearth wrote:
I've now performed the correct calculation (and learnt a bit more about how to use numbers in Apple) and get a SD for HYP1 of 0.166 and for FTSE100 of 0.148. So HYP1 still comes out riskier from the pov of volatility.
Just using the annual data so probably can't read too much into this exercise but it gave me something to do for a quiet pre-xmas morning.
Itsallaguess wrote:Bubblesofearth wrote:
I've now performed the correct calculation (and learnt a bit more about how to use numbers in Apple) and get a SD for HYP1 of 0.166 and for FTSE100 of 0.148. So HYP1 still comes out riskier from the pov of volatility.
Just using the annual data so probably can't read too much into this exercise but it gave me something to do for a quiet pre-xmas morning.
And if a HYP1 owner asked how that capital-focussed risk-assessment might explain any risk-based concerns that they might have about ongoing risk to their primary reason for choosing the HYP strategy, which is related to the regular and safe deliver of long-term *hands-free income*, how would you answer them?
Cheers,
Itsallaguess
Bubblesofearth wrote:Itsallaguess wrote:
And if a HYP1 owner asked how that capital-focussed risk-assessment might explain any risk-based concerns that they might have about ongoing risk to their primary reason for choosing the HYP strategy, which is related to the regular and safe deliver of long-term *hands-free income*, how would you answer them?
I'd say the risk-assessment is probably meaningless cos it's based on annual data.
Bubblesofearth wrote:GeoffF100 wrote:I am not suggesting that it is a good idea to do it in practice. The suggested calculation should give you some idea of the effect of rebalancing on volatility, and perhaps performance. There are lots of people here who seem to believe in equal weighting (AKA cut your winners and add to your losers). Run your winners and cut your losers? Lots of people believe in that. Evidence? I could not find anything convincing, but there are certainly momentum effects in the market. Do momentum funds always win? No. Equal weighting?
https://seekingalpha.com/article/460794 ... 00-indexes
Thanks to help from itsallaguess I've managed to calculate the standard deviation for both HYP1 and the FTSE100 over the 22 year lifetime of HYP1. I've only used annual data as that's all that is readily available so I accept the inherent inaccuracy this will entail. The result is that HYP1 has a SD some 2.68x that shown by the index.
I've not attempted any SD calculations for rebalanced portfolios as I'm not comfortable doing this whilst retaining all the original shares. It's not a method by which I would invest.
One thought that occurs to me is that SD calculations would, by their nature, give a volatility for cash on deposit that is higher than cash under the mattress, i.e. it would be deemed higher risk. The higher the interest rate the higher this SD, and therefore volatility risk, would be. Indeed, if the interest rate were high enough it could give an SD higher than the stock market. This is clearly nonsense as cash on deposit is generally seen as zero risk.
Does this mean that the SD for a more strongly growing portfolio will tend to be higher than for a stagnant one? Is this a reason HYP1 shows a higher SD than FTSE100? If so then the attribution of higher risk for HYP1 could be wrong in any sense that matters to the investor.
Far me to argue with various Nobel laureates but I do wonder if there is a better measure of risk than SD?
On the subject of investment strategy my preference is for equal weight on purchase followed by LTBH. Outside of HYP there is very little in the literature about this approach, probably because it's not one that easily lends itself to fund management.
BoE
Itsallaguess wrote:But if we could pretend for a minute that your capital-focussed data was at a granular level that you were happy with, how would you answer that question?
I appreciate your further point about the exercise being an interesting one for other reasons, and if the comparisons you were using for the capital-focussed risk-comparison exercise hadn't used a income-focussed strategy as part of it then I'd not be raising this point at all, but given that HYP1 has been major focus of your 'risk-based question', and the answer you've come up with has solely used capital-values to get to your 'answer', then I hope you'll appreciate why I'm looking to understand things a little further in terms of what you think a HYP1 owner might have got out of the 'risk-answer' that you've currently got...
Cheers,
Itsallaguess
Bubblesofearth wrote:[It is also one of very few examples of a LTBH portfolio that has been going for more than 20 years, enough time IMO for the data to start to be meaningful.
Bubblesofearth wrote:Itsallaguess wrote:
But if we could pretend for a minute that your capital-focussed data was at a granular level that you were happy with, how would you answer that question?
I appreciate your further point about the exercise being an interesting one for other reasons, and if the comparisons you were using for the capital-focussed risk-comparison exercise hadn't used a income-focussed strategy as part of it then I'd not be raising this point at all, but given that HYP1 has been major focus of your 'risk-based question', and the answer you've come up with has solely used capital-values to get to your 'answer', then I hope you'll appreciate why I'm looking to understand things a little further in terms of what you think a HYP1 owner might have got out of the 'risk-answer' that you've currently got...
I deliberately posted on this board rather than HYP practical because I wanted to explore the relative risk posed by different approaches, specifically rebalancing vs LTBH. HYP1 just happens to be the most well known example of discussions around these different strategies. It is also one of very few examples of a LTBH portfolio that has been going for more than 20 years, enough time IMO for the data to start to be meaningful. If I had posted on HYP practical then I suspect the thread would have been moved across pretty quickly exactly because of the question you raise.
For myself I consider total return the only measure to be important. I like the HYP approach for a number of reasons, specifically equal weight on purchase, sectoral diversification, LTBH. For reasons that are probably best discussed in a separate thread, it's an approach that I believe can outperform the market(s) the portfolio is taken from.
If looking only at income floats some peoples boats then, fine, I'm only too aware that nothing will alter their perspective. Obviously such a person will likely not be that bothered about fluctuations in capital value so might not even ask about them in the first place? We've lived through a long period where any falls in both income and capital have been recovered from and I suspect this will have made a lot of people blasé, not just about capital values but about stock market investing in general. If you asked US investors in the 1930's or Japanese investors in the 2000's they might have felt differently?
GeoffF100 wrote:Bubblesofearth wrote:[It is also one of very few examples of a LTBH portfolio that has been going for more than 20 years, enough time IMO for the data to start to be meaningful.
Market weighted trackers are LTBH portfolios and they have been in existence for more than 20 years.
Itsallaguess wrote:Thanks for that, but it's interesting that in the very first post on this thread you seem to be trying to pin down a definition of 'risk' so that a more common understanding of the term might be engendered on these boards, but you then go about doing so in a way that's actually likely to muddy the waters further than they ever were, where you actively choose a specifically income-focussed strategy portfolio as one half of the 'risk discussion' that you use to end up at 'your' definition of risk, that in reality and in terms of only using capital values to reach your conclusion, probably couldn't be further from one of the primary-concerns around 'risk' that an income-investor is likely to be interested in, being one that potentially considers the *income-delivery risk* side of their chosen investment approach...
It seems to me that if you were looking to find some agreeable middle-ground between income-investors and total-return investors when it comes to the use of the word 'risk', then you're going to have to work harder on considering more than just one of those parties, and more than just one of those strategic aims and preferences...
If I were to have come up with a 'risk answer' that only looked at portfolio income-risk, with no consideration of risk to capital or total-return, you'd of course be quite right to be taking the opposite side to my question, and rightly be asking me where that consideration was in my 'risk answer'...
Cheers,
Itsallaguess
Itsallaguess wrote:If I were to have come up with a 'risk answer' that only looked at portfolio income-risk, with no consideration of risk to capital or total-return, you'd of course be quite right to be taking the opposite side to my question, and rightly be asking me where that consideration was in my 'risk answer'...
hiriskpaul wrote:I thought I would add that volatility is not the only risk metric. Others are available. Value at risk (VaR) is a very commonly used metric. With VaR you calculate what would happen to your portfolio over the next day for a set of historical daily changes. You then line those up from best to worse performance and take the 97th percentile of the distribution. The loss is called the Value at Risk.
Another approach is to consider absolute movements. These tend to be more useful for portfolios that include financial derivatives, but the way it works is you calculate the loss according to specific events. eg how much would I lose if the S&P 500 dropped by 1% tomorrow? Or the risk free rate moved up 0.25%, or for portfolios with financial derivatives, what would happen if implied volatility spiked 5%. Sometimes you would have to model the impacts on particular portfolio constituents. For example if your portfolio has a higher than average proportion of of volatile shares you need to take that into account.
All this can get very involved and is hard if you don't have adequate data. Nonetheless, it is what banks etc. do to manage their risks.
Edit, for some securities volatility is a hopeless risk metric. I am thinking about very illiquid things here, such as mortgage backed securities, micro caps and non-listed shares. A market price, even if you can get one, may not move for weeks on end simply because there have been no trades and/or no MMs to move the price.
Bubblesofearth wrote:Itsallaguess wrote:But if we could pretend for a minute that your capital-focussed data was at a granular level that you were happy with, how would you answer that question?
I appreciate your further point about the exercise being an interesting one for other reasons, and if the comparisons you were using for the capital-focussed risk-comparison exercise hadn't used a income-focussed strategy as part of it then I'd not be raising this point at all, but given that HYP1 has been major focus of your 'risk-based question', and the answer you've come up with has solely used capital-values to get to your 'answer', then I hope you'll appreciate why I'm looking to understand things a little further in terms of what you think a HYP1 owner might have got out of the 'risk-answer' that you've currently got...
Cheers,
Itsallaguess
I deliberately posted on this board rather than HYP practical because I wanted to explore the relative risk posed by different approaches, specifically rebalancing vs LTBH. HYP1 just happens to be the most well known example of discussions around these different strategies. It is also one of very few examples of a LTBH portfolio that has been going for more than 20 years, enough time IMO for the data to start to be meaningful. If I had posted on HYP practical then I suspect the thread would have been moved across pretty quickly exactly because of the question you raise.
For myself I consider total return the only measure to be important. I like the HYP approach for a number of reasons, specifically equal weight on purchase, sectoral diversification, LTBH. For reasons that are probably best discussed in a separate thread, it's an approach that I believe can outperform the market(s) the portfolio is taken from.
If looking only at income floats some peoples boats then, fine, I'm only too aware that nothing will alter their perspective. Obviously such a person will likely not be that bothered about fluctuations in capital value so might not even ask about them in the first place? We've lived through a long period where any falls in both income and capital have been recovered from and I suspect this will have made a lot of people blasé, not just about capital values but about stock market investing in general. If you asked US investors in the 1930's or Japanese investors in the 2000's they might have felt differently?
BoE
vand wrote:what people think risk vs reward means, and what it really means:
hiriskpaul wrote:I thought I would add that volatility is not the only risk metric. Others are available. Value at risk (VaR) is a very commonly used metric. With VaR you calculate what would happen to your portfolio over the next day for a set of historical daily changes. You then line those up from best to worse performance and take the 97th percentile of the distribution. The loss is called the Value at Risk.
Another approach is to consider absolute movements. These tend to be more useful for portfolios that include financial derivatives, but the way it works is you calculate the loss according to specific events. eg how much would I lose if the S&P 500 dropped by 1% tomorrow? Or the risk free rate moved up 0.25%, or for portfolios with financial derivatives, what would happen if implied volatility spiked 5%. Sometimes you would have to model the impacts on particular portfolio constituents. For example if your portfolio has a higher than average proportion of of volatile shares you need to take that into account.
All this can get very involved and is hard if you don't have adequate data. Nonetheless, it is what banks etc. do to manage their risks.
Edit, for some securities volatility is a hopeless risk metric. I am thinking about very illiquid things here, such as mortgage backed securities, micro caps and non-listed shares. A market price, even if you can get one, may not move for weeks on end simply because there have been no trades and/or no MMs to move the price.