Got a credit card? use our Credit Card & Finance Calculators
Thanks to eyeball08,Wondergirly,bofh,johnstevens77,Bhoddhisatva, for Donating to support the site
Harry Browne's Permanent Portfolio
-
1nvest
- Lemon Quarter
- Posts: 4402
- Joined: May 31st, 2019, 7:55 pm
- Has thanked: 691 times
- Been thanked: 1342 times
Re: Harry Browne's Permanent Portfolio
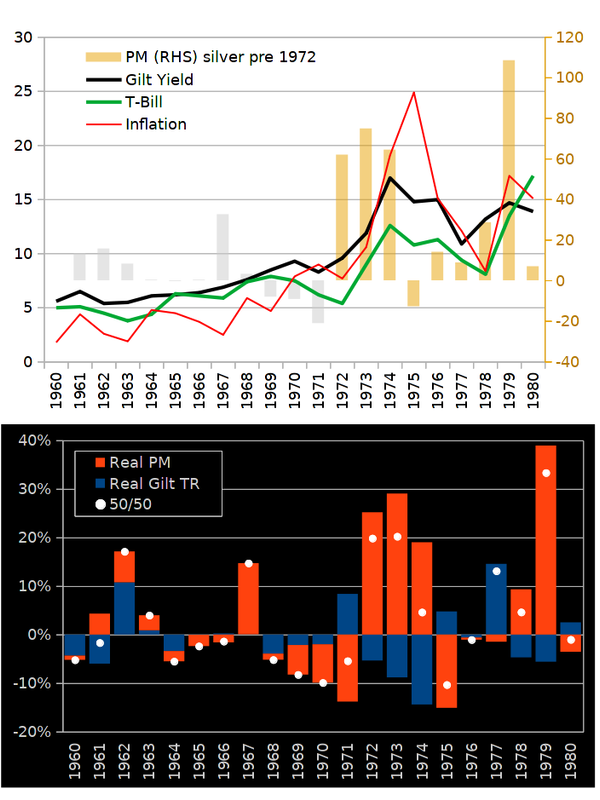
Correlation (patterns) between inflation, interest rates, long dated gilt and gold over the 1960's/70's rising interest rate period
-
1nvest
- Lemon Quarter
- Posts: 4402
- Joined: May 31st, 2019, 7:55 pm
- Has thanked: 691 times
- Been thanked: 1342 times
Re: Harry Browne's Permanent Portfolio
Side by side comparison of US and UK PP's
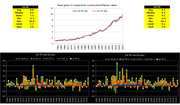
Similar real gains, but where in some years its different assets that carries the portfolio. Mixing in foreign stocks or bonds would upset the multi-way overall balance.
Similar real gains, but where in some years its different assets that carries the portfolio. Mixing in foreign stocks or bonds would upset the multi-way overall balance.
-
1nvest
- Lemon Quarter
- Posts: 4402
- Joined: May 31st, 2019, 7:55 pm
- Has thanked: 691 times
- Been thanked: 1342 times
Fear not the PP's long dated Gilts in low interest rate environment
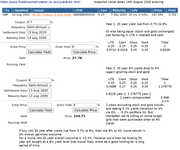
For a PP with a 20 year gilt, if in year 1 the yield rises from 0.5% to perhaps 6% in reflection of inflation spiking (or whatever), and then in year 2, after having rebalanced and assuming all other of the PP assets remained unchanged 20 year yields fell from 6% to 4% ... then the PP endures a -8.7% overall compounded hit over those two years.
For 30 year Gilt holdings the corresponding figure is -9.3%
Factor in cash and the figures are -6.2% and -6.8% respectively for the 20 and 30 year Gilts.
If yields during that transition move more negative in real terms then likely gold will do well, otherwise stocks may perform OK, and potentially dilute down the portfolio hit even further - perhaps not even see any hit at all.
If you are fearful of the PP's long dated Gilt element, best perhaps to not drop it altogether, neither is shortening down the duration of much potential benefit. Maybe the only action might be to reduce the Gilt weighting to 20% instead of 25%, increase the cash weighting from 25% to 30% - but again any benefits of doing that will be relatively mild.
-
1nvest
- Lemon Quarter
- Posts: 4402
- Joined: May 31st, 2019, 7:55 pm
- Has thanked: 691 times
- Been thanked: 1342 times
Re: Harry Browne's Permanent Portfolio
... on further thought, a good current choice in view of low yields would be to shorten down both the duration and exposure to 20% weighting in 20 year Gilts, so 30% weighting to cash, and then after Gilts did take a sizeable hit due to rising rates, revert back to 25% weighting and rotate into a 30 year Gilt series. For that same 0.5% current yield, rising to 6% at the end of year 1, and down to 4% at the end of year 2 yield transition, the combined long dated gilt and cash half of the PP would be near break even, be less than 1% down. As to how the other half of the PP, stocks and gold might perform, well that's subjective to the relation between nominal yields and inflation (real yields). If a decline in real yields was evident then likely it would be gold that was the years winning asset, otherwise stocks would likely be up.
Harry Browne did advocate sticking with domestic stocks and holding the longest dated Gilt (Treasury) available. Using 30 year Gilt yields since 1986 alongside FT250 for the stock holdings ...
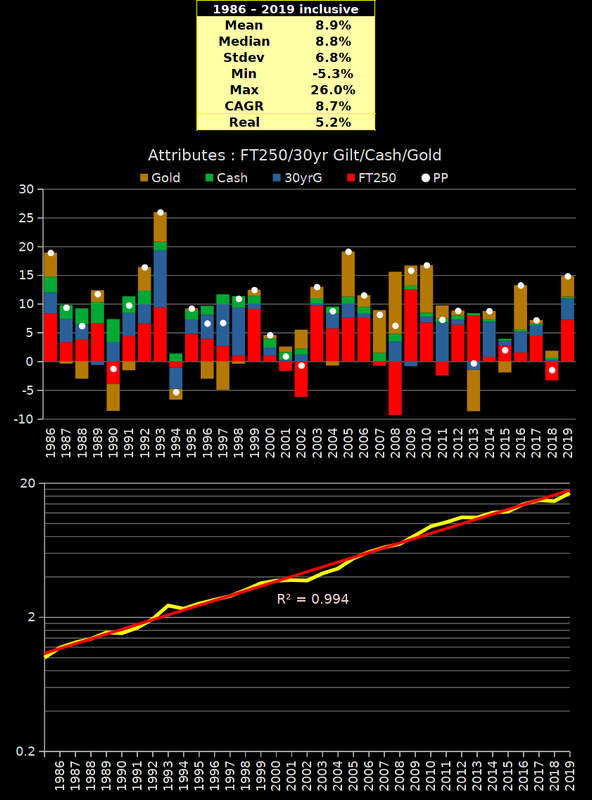
That used T-Bill yields for the 'cash' element, rewards might have been further improved by substituting alternatives to that, such as a three or five year ladder of High Street Bank/Building Society fixed term bonds.
Harry Browne did advocate sticking with domestic stocks and holding the longest dated Gilt (Treasury) available. Using 30 year Gilt yields since 1986 alongside FT250 for the stock holdings ...
That used T-Bill yields for the 'cash' element, rewards might have been further improved by substituting alternatives to that, such as a three or five year ladder of High Street Bank/Building Society fixed term bonds.
-
1nvest
- Lemon Quarter
- Posts: 4402
- Joined: May 31st, 2019, 7:55 pm
- Has thanked: 691 times
- Been thanked: 1342 times
Re: Harry Browne's Permanent Portfolio
Just posted this over on the Gilts board/section viewtopic.php?p=333062#p333062 that has some relevance to the PP
All else being equal (stocks and gold assumed 0% change) and a transition from recent 0.7% yields on 20 year Gilts, rising to 4% (via 8%) yields, could see just a few percentage point PP hit, but then be sitting on a sizeable amount of gilts purchased at relatively high yields/low prices - that might then subsequently pay off handsomely over many years.
All else being equal (stocks and gold assumed 0% change) and a transition from recent 0.7% yields on 20 year Gilts, rising to 4% (via 8%) yields, could see just a few percentage point PP hit, but then be sitting on a sizeable amount of gilts purchased at relatively high yields/low prices - that might then subsequently pay off handsomely over many years.
-
1nvest
- Lemon Quarter
- Posts: 4402
- Joined: May 31st, 2019, 7:55 pm
- Has thanked: 691 times
- Been thanked: 1342 times
Harry Browne's Radio Shows
https://www.youtube.com/channel/UCzu55W ... QIQ/videos
And within that "Building a Permanent Portfolio" https://youtu.be/7uFPVjMC-IE
And within that "Building a Permanent Portfolio" https://youtu.be/7uFPVjMC-IE
-
hiriskpaul
- Lemon Quarter
- Posts: 3883
- Joined: November 4th, 2016, 1:04 pm
- Has thanked: 694 times
- Been thanked: 1519 times
Re: Harry Browne's Permanent Portfolio
1nvest wrote:... on further thought, a good current choice in view of low yields would be to shorten down both the duration and exposure to 20% weighting in 20 year Gilts, so 30% weighting to cash, and then after Gilts did take a sizeable hit due to rising rates, revert back to 25% weighting and rotate into a 30 year Gilt series. For that same 0.5% current yield, rising to 6% at the end of year 1, and down to 4% at the end of year 2 yield transition, the combined long dated gilt and cash half of the PP would be near break even, be less than 1% down. As to how the other half of the PP, stocks and gold might perform, well that's subjective to the relation between nominal yields and inflation (real yields). If a decline in real yields was evident then likely it would be gold that was the years winning asset, otherwise stocks would likely be up.
Harry Browne did advocate sticking with domestic stocks and holding the longest dated Gilt (Treasury) available. Using 30 year Gilt yields since 1986 alongside FT250 for the stock holdings ...
That used T-Bill yields for the 'cash' element, rewards might have been further improved by substituting alternatives to that, such as a three or five year ladder of High Street Bank/Building Society fixed term bonds.
Interesting charts. What would the returns of the constituent parts have been, assuming no rebalancing and reinvestment of distributions into the asset classes they come from?
-
1nvest
- Lemon Quarter
- Posts: 4402
- Joined: May 31st, 2019, 7:55 pm
- Has thanked: 691 times
- Been thanked: 1342 times
Re: Harry Browne's Permanent Portfolio
What would the returns of the constituent parts have been, assuming no rebalancing and reinvestment of distributions into the asset classes they come from?
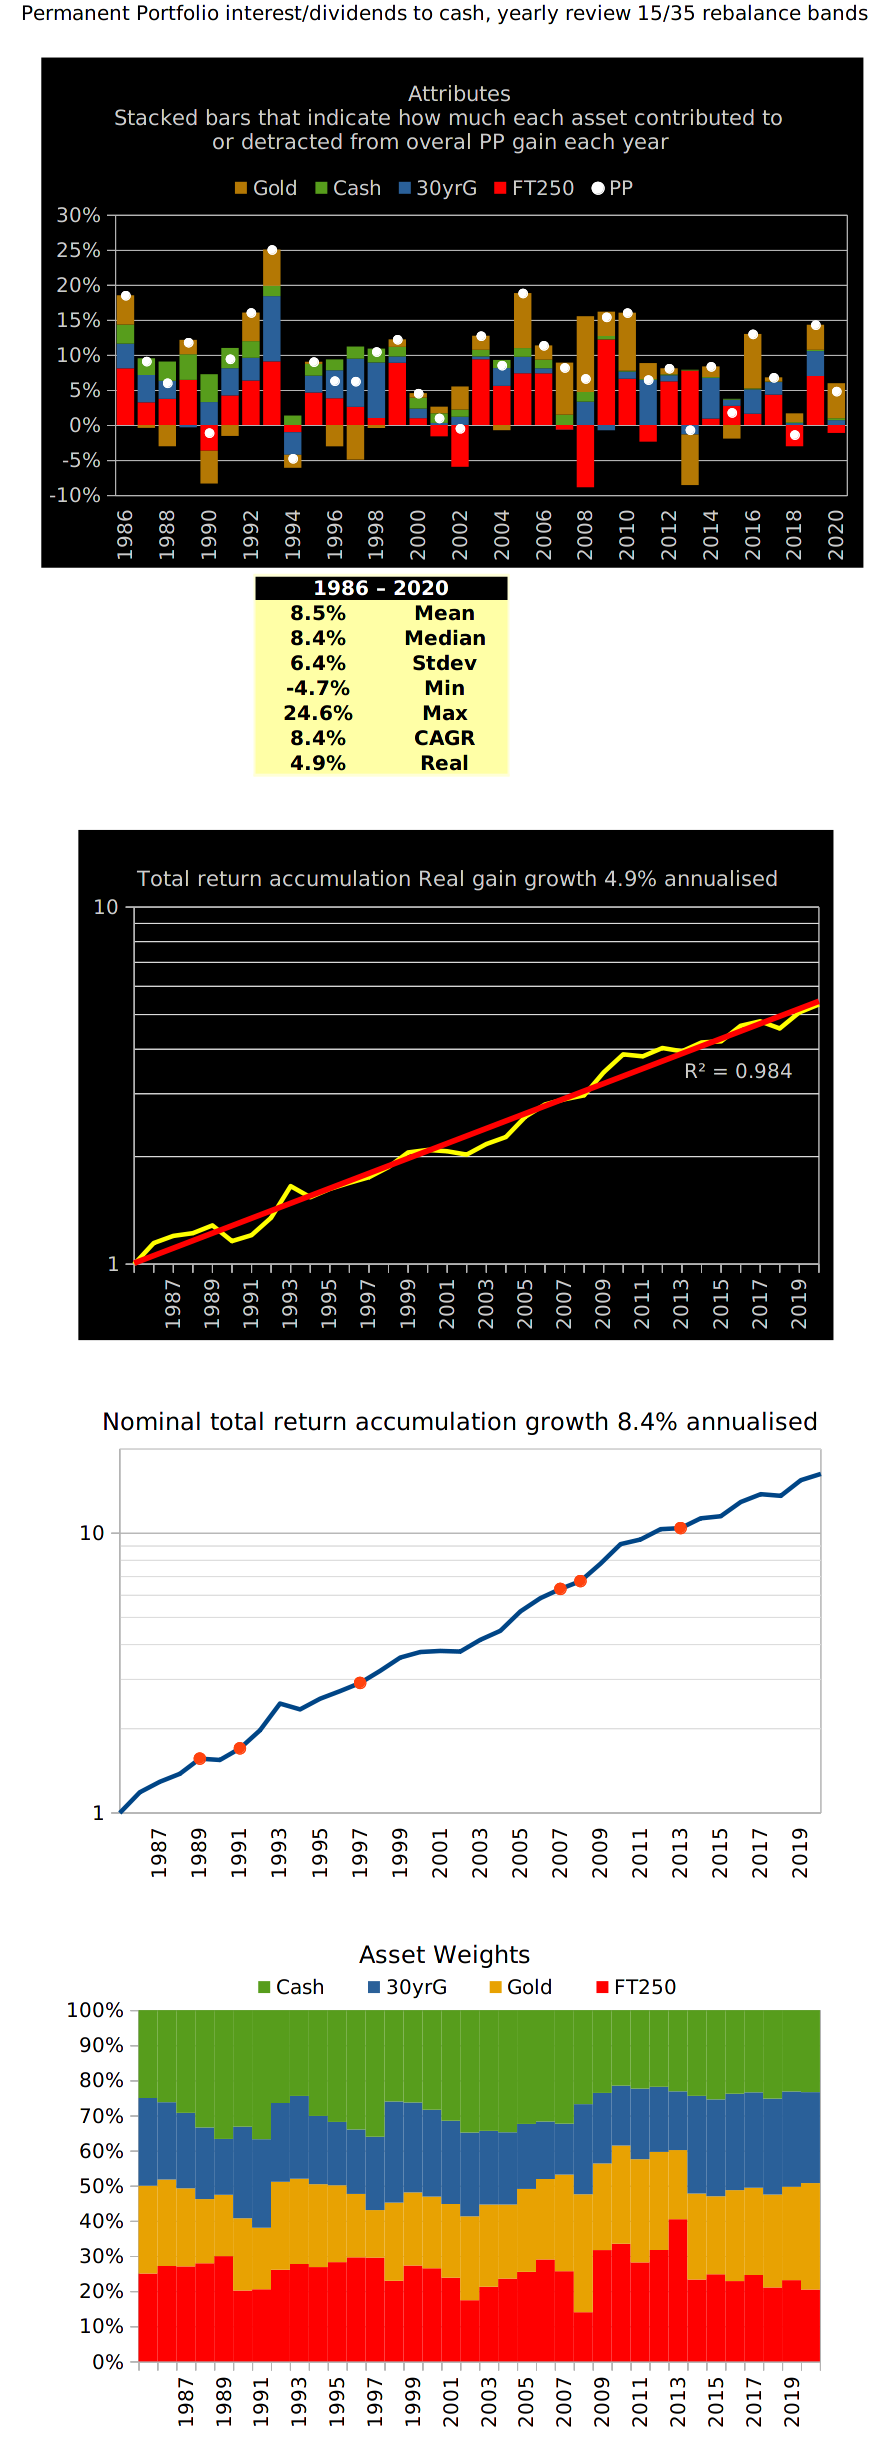
Bought and held, reinvesting all income back into the asset generating that income ...
Mean 9.5%
Median 11.8%
Stdev 9.1%
Min -12.3%
Max 27.5%
CAGR 9.1%
But where that ended with just 6.5% in gold, 8.2% cash, 27% in long dated gilt, 58% in stock weightings.
Much of the PP is that each asset has the potential to be the years best performing and the choice of assets is such that one will tend to be winning, and where the winners upside counters and more the combined 'rest'. But where it may be pairs of assets that are doing well under the ongoing climate/circumstances. By not rebalancing the drift turns that into no longer being the 'risk parity' PP.
Harry considered less than 3% inflation to be pretty much meaningless, inflation and when gold stepped up to the mark was for him when 5%, 10%, 15% type inflation events were evident. At such times typically real yields move negative and gold does well. During prosperity stocks do well. During deflation (when yields decline) long dated Gilts do well. Nothing does particularly well during recessions but recessions tend to be short lived, a year or less more often, but maybe out to 18 months in his view.
He reckoned that no matter what the events the present cycle will fall into one of those and having a asset that does well in each serves as the counter-balance. History indicates that there are few bad years for the total portfolio value, and where they do occur they're relatively mild and typically short-lived (offset by adjacent years).
-
1nvest
- Lemon Quarter
- Posts: 4402
- Joined: May 31st, 2019, 7:55 pm
- Has thanked: 691 times
- Been thanked: 1342 times
Re: Harry Browne's Permanent Portfolio
As equally as one asset might be expected to do well each year, so another can be expected to do badly. I've been expecting that to be long dated Gilts for a while now, however time after time (year after year) that's mostly been proved wrong. Sooner or later it will however be the years worst performer, perhaps by a large amount. In being diluted down however to just 25% allocation the hit relative to the total portfolio is milder. And in continuing to hold rather than ejecting it, you'll then rebalance to add more, potentially at great yields/time.
In practice however since post 2008/9 financial crisis since when many have said it was lousy to hold long dated Gilts, they only had one way to go, they've actually put on >100% gains. So in that context even if they halve they're now just giving back rather than actually consuming. Harry did mention how what seems expensive today can become even more expensive tomorrow and that's certainly been the case with long dated Gilts since 2009.
I see the PP as being more of a Linkers (index linked gilts) alternative, but where instead of -2.5% real yields as per linkers, the PP could reward +3% real or more, so a +5.5% greater reward, but at the cost of less consistency. It provides reasonable rewards relatively consistently. If investors could lock into Linkers at +4% real rewards many would back up the truck to load up on those. But more often its compared relative to stock heavy portfolios which it will tend to lag - and that puts many off holding it.
-
1nvest
- Lemon Quarter
- Posts: 4402
- Joined: May 31st, 2019, 7:55 pm
- Has thanked: 691 times
- Been thanked: 1342 times
Re: Harry Browne's Permanent Portfolio
1nvest wrote:Just posted this over on the Gilts board/section viewtopic.php?p=333062#p333062 that has some relevance to the PP
All else being equal (stocks and gold assumed 0% change) and a transition from recent 0.7% yields on 20 year Gilts, rising to 4% (via 8%) yields, could see just a few percentage point PP hit, but then be sitting on a sizeable amount of gilts purchased at relatively high yields/low prices - that might then subsequently pay off handsomely over many years.
Should emphasise that is all just a prediction, that could very well turn out to have been wrong. If anywhere near accurate however, during the run up from 0.5% long dated gilt yields to 8%, when long dated gilts take a massive hit, so inflation could very well exceed interest rates, potentially by a large amount, maybe -8% real type levels and under which conditions gold will tend to soar in price. Stocks would also tend to drop, a lot.
If for instance Gilts were 10p on the £1, stocks halved, gold doubled, cash was up perhaps 2% interest, then across those equal 0.25 weightings each, combined value would see nearly a -10% portfolio hit. But where the Gilts alone had more or less seen nearly all of the holdings being swapped out from 0.5% yielding to 8% yielding. And where likely in a following year there would be good overall portfolio gains that offset that loss.
Looking at US data since 1972 with the short and long dated treasury barbell replaced with a 10 year bullet as that services long dated treasury data doesn't go that far back, the annual returns chart near the bottom indicates that 1981 was the worst single year case when a -6.6% loss occurred. So perhaps gold might see a even greater reward than I've used above, or maybe stocks might not halve but decline less. Or as quite likely, maybe something entirely different to that prediction occurs.
In that US 1981 worst year case 1982 saw a massive up year gain of nearly +29%. In the UK's case it was more like 1994 being a historic bad/worst case year also with around a -6% drop, but where instead of it being the following year that was a good year, it was the prior 1993 year where a over +25% gain occurred.
-
1nvest
- Lemon Quarter
- Posts: 4402
- Joined: May 31st, 2019, 7:55 pm
- Has thanked: 691 times
- Been thanked: 1342 times
Re: Harry Browne's Permanent Portfolio Radio Show
A more condensed version of Harry's Permanent Portfolio Radio Show that outlines the relationship between the four possible economic conditions that always has one applying at any one time and the Permanent Portfolio asset pairings to each of those ...
Prosperity - good for stocks and bonds (interest rates falling), gold doesn't do well, cash is neutral but is a foregone opportunity (would have done better to have had the cash invested in stocks or bonds).
Inflation stocks and bonds do poorly as interest rates tend to rise, gold does well, cash does poorly
Deflation - bad for stocks, gold does poorly, cash is good, bonds do extremely well as interest rates collapse. He highlights how during the 1930's bond yields were down at 1% levels and Treasury Bills were trading at a negative interest rates.
Recession - no assets does well, but recessions tend to be short lived (often less than a year, but can run out to 18 months).
He further details how it takes only one of the assets to be performing well to offset the combined declines in the other assets.
-
hiriskpaul
- Lemon Quarter
- Posts: 3883
- Joined: November 4th, 2016, 1:04 pm
- Has thanked: 694 times
- Been thanked: 1519 times
Re: Harry Browne's Permanent Portfolio
1nvest wrote:What would the returns of the constituent parts have been, assuming no rebalancing and reinvestment of distributions into the asset classes they come from?
Bought and held, reinvesting all income back into the asset generating that income ...
Mean 9.5%
Median 11.8%
Stdev 9.1%
Min -12.3%
Max 27.5%
CAGR 9.1%
But where that ended with just 6.5% in gold, 8.2% cash, 27% in long dated gilt, 58% in stock weightings.
Much of the PP is that each asset has the potential to be the years best performing and the choice of assets is such that one will tend to be winning, and where the winners upside counters and more the combined 'rest'. But where it may be pairs of assets that are doing well under the ongoing climate/circumstances. By not rebalancing the drift turns that into no longer being the 'risk parity' PP.
Harry considered less than 3% inflation to be pretty much meaningless, inflation and when gold stepped up to the mark was for him when 5%, 10%, 15% type inflation events were evident. At such times typically real yields move negative and gold does well. During prosperity stocks do well. During deflation (when yields decline) long dated Gilts do well. Nothing does particularly well during recessions but recessions tend to be short lived, a year or less more often, but maybe out to 18 months in his view.
He reckoned that no matter what the events the present cycle will fall into one of those and having a asset that does well in each serves as the counter-balance. History indicates that there are few bad years for the total portfolio value, and where they do occur they're relatively mild and typically short-lived (offset by adjacent years).
Interesting thanks. Might be tricky to do, but how would this have worked out if an income of say 3.5% real was taken from the PP 1) with normal rebalancing; 2) with no rebalancing and the withdrawal made from the largest asset each year?
-
1nvest
- Lemon Quarter
- Posts: 4402
- Joined: May 31st, 2019, 7:55 pm
- Has thanked: 691 times
- Been thanked: 1342 times
Re: Harry Browne's Permanent Portfolio
hiriskpaul wrote:Might be tricky to do, but how would this have worked out if an income of say 3.5% real was taken from the PP 1) with normal rebalancing; 2) with no rebalancing and the withdrawal made from the largest asset each year?
Can't say for the non rebalanced, but for yearly rebalanced back to equal weightings (i.e. mathematical model), for all 50 year period start years since 1953, calendar year granularity, the worst case after 3.5% SWR had 55% of the inflation adjusted start date value remaining at the end of the 50 years. Average case had 125% of the inflation adjusted start date value remaining at the end of the 50 years.
If you two year, three time point averaged into the PP then the worst case increased to 73%. Which in my book is close enough to being a PWR (perpetual withdrawal rate).
Shame that there's no online tools like portfoliovisualizer for UK data. Where you can run backtests including SWR withdrawals like this
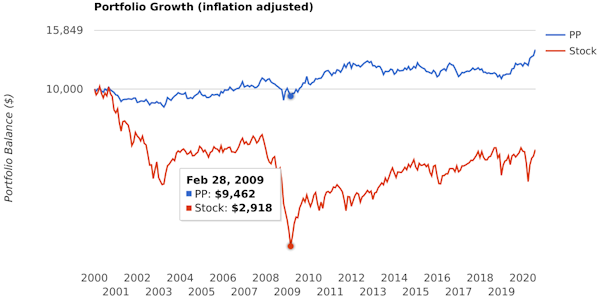
A case of ouch for a US all-stock investor who retired at the start of 2000 using a 3.5% SWR, seeing $10K of portfolio value dropping to less than $3K in inflation adjusted terms in early 2009. Since somewhat recovered, assuming they didn't bail out (which some likely did to save what little was left of their life-long savings).
On the flip side at other times the all-stock investor did better than the PP. The PP more middle roads consistent outcomes whilst all-stock zigzags around that.
-
1nvest
- Lemon Quarter
- Posts: 4402
- Joined: May 31st, 2019, 7:55 pm
- Has thanked: 691 times
- Been thanked: 1342 times
Re: Harry Browne's Permanent Portfolio
1nvest wrote:Just for reference - cross linking ... Permanent Portfolio Review - Year 2 thread.
... And yet another cross link here (Multi-Region Permanent Portfolio)
-
1nvest
- Lemon Quarter
- Posts: 4402
- Joined: May 31st, 2019, 7:55 pm
- Has thanked: 691 times
- Been thanked: 1342 times
Re: Harry Browne's Permanent Portfolio
Another cross reference/link ... about gold
https://lemonfool.co.uk/viewtopic.php?f=8&t=27923
https://lemonfool.co.uk/viewtopic.php?f=8&t=27923
-
1nvest
- Lemon Quarter
- Posts: 4402
- Joined: May 31st, 2019, 7:55 pm
- Has thanked: 691 times
- Been thanked: 1342 times
Re: Harry Browne's Permanent Portfolio
2020 calendar year +5% for the PP
No rebalance event, continues with just 6 rebalance events in total to date. i.e. rebalance all holdings back to 25% weighting if at the yearly review date any one of the assets has risen to being 35% or more weighting, or declined to 15% or lower weighting.
FT250 for stock, 30 year Gilt for the long dated treasury holding. All interest/dividends added to the 'cash' component.
-
1nvest
- Lemon Quarter
- Posts: 4402
- Joined: May 31st, 2019, 7:55 pm
- Has thanked: 691 times
- Been thanked: 1342 times
Re: Harry Browne's Permanent Portfolio
Yearly total returns for PPLS40 and PP respectively
PPLS40 holds 72% in Vanguards LifeStrategy 40 (40% stock, 60% bonds) along with 28% gold, so more of a PP with 28% in each of stocks and gold. PP is the standard Permanent Portfolio.
With a 0.22% expense ratio for LS40 holding 72% exposure in that equates to a overall 0.15% type proportioned expense level, excluding any cost of holding gold.
i.e. a simple one fund + gold PP-like portfolio, where LS40 is also more globally diversified for both bonds and stocks.
2015	-0.8	        1.7
2016	19.0	        12.5
2017	5.3	        6.6
2018	-0.2	        -1.3
2019	13.0	        13.7
2020	11.2	        5.3
PPLS40 holds 72% in Vanguards LifeStrategy 40 (40% stock, 60% bonds) along with 28% gold, so more of a PP with 28% in each of stocks and gold. PP is the standard Permanent Portfolio.
With a 0.22% expense ratio for LS40 holding 72% exposure in that equates to a overall 0.15% type proportioned expense level, excluding any cost of holding gold.
i.e. a simple one fund + gold PP-like portfolio, where LS40 is also more globally diversified for both bonds and stocks.
-
1nvest
- Lemon Quarter
- Posts: 4402
- Joined: May 31st, 2019, 7:55 pm
- Has thanked: 691 times
- Been thanked: 1342 times
Re: Harry Browne's Permanent Portfolio
PP using 50% in a 10 year ladder instead of a 25% in each of short and long dated barbell viewtopic.php?p=391229#p391229
-
1nvest
- Lemon Quarter
- Posts: 4402
- Joined: May 31st, 2019, 7:55 pm
- Has thanked: 691 times
- Been thanked: 1342 times
Re: Harry Browne's Permanent Portfolio
Harry Browne was OK with using 25% allocations to each of the four assets, with 15% lower and 35% upper bands at which on reaching/breaching you'd rebalance the portfolio back to 25% equal weightings.
Applying some relative valuations that utilise those levels from 1970 for UK data indicates a 1% higher reward with comparable risk (worst case). Fundamentally improved the upside (best year), didn't increase risk (worst year).
I used a very basic relative valuation model for that. If the Dow/Gold ratio was below 10 at a yearly review timepoint then gold being considered relatively expensive/stock inexpensive (for example in 1980 it took just a ounce of gold to buy the Dow). If the Dow/Gold ratio at the review date was above 15 then gold considered relatively inexpensive/stocks expensive.
Similarly for interest rates, below 4% considered as bonds being relatively expensive, above 6% and bonds considered as relatively inexpensive.
For those I set 15% weightings below the trigger point, 35% weighting when above the trigger point otherwise 25% weighting. Reviewing once/year and otherwise just leaving it to run.
Presently for instance, with interest rates low, below the 4% level, long dated gilts are weighted 15%, short dated weighted 35%. The usual PP's 50/50 short (1 year) and long (20 year) combine to a central 10 year bond bullet, but when relative valuation can adjusts that between 15/35 to 35/15, that's a bit like being in a 5 year bullet when yields are low, 15 year bullet when yields are high, otherwise a 10 year bullet. And similar for stocks and gold according to the Dow/Gold ratio. 35/15 stock/gold or 50/50 stock/gold or 15/35 stock/gold.
At recent levels i.e. for 2021 its 15% long dated gilt, 35% short dated gilt, or alternatively 50% in 5 year gilts; Along with 15% stock, 35% gold.
The extra percent that added to annualised rewards since 1970 is nice, more like 6.5% annualised real for instance instead of 5.5%. Whilst the worst year was marginally better, -4.6% instead of -4.9%.
-
1nvest
- Lemon Quarter
- Posts: 4402
- Joined: May 31st, 2019, 7:55 pm
- Has thanked: 691 times
- Been thanked: 1342 times
Re: Harry Browne's Permanent Portfolio
Long dated Gilt losses as/when inflation is achieved may be much lower than what some opine viewtopic.php?p=395969#p395969
Return to “Investment Strategies”