3.3% SWR of sorts, applied to equal amounts of FT250, BRK, 10yr Gilt Ladder
Posted: May 5th, 2021, 10:56 am
Yearly rebalance equal amounts of FT250 (domestic stocks, UK mid cap is small cap in US scale, and being a midcap index feeds in and out of both the top and bottom so is more characteristic of a equal weighted type holding), BRK (foreign stocks (US) Berkshire Hathaway, a diverse conglomerate holding with no fees and doesn't pay dividends so no issues with dividends currency conversion costs if held within a ISA), and a 10 year Gilt ladder.
Calendar years

I like to benchmark to TJH HYP accumulation, I use end of March monthly data (in being around the start/end of fiscal years you can selectively rebalance in the old financial year, new financial year, or a combination of both according to whatever might be the more tax efficient), Terry uses actual fiscal years (April 5th) so there's some slight misalignment in individual years but that broadly washes over time.
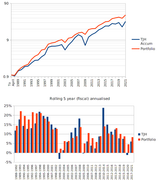
Concept : If you loaded the third in Gilt holdings as monthly 12 overlapping 10 year gilt ladders i.e. one 10 year gilt matures every month, then that's on average 3.3% of the portfolio value each month being dumped into cash (a single Gilt holding matures each month). Spend that (as your monthly 'wage') and buy another 10 year Gilt with 3.3% of the portfolio value at that time.
Somewhat like a 3.3% SWR approach, but that would tend to see variations in how much £££ was loaded into each 'rung', so not a precise inflation adjusted income as per SWR where you scale up a fixed income amount by inflation and draw that amount, however where the general tendency would be to see income rise ahead of inflation over time. Over the long term (century+) of historic outcome that 3.3% SWR was a PWR (perpetual withdrawal rate) and the broad average was to see income rise at 3.5% ahead of inflation (rising income over time averaged inflation + 3.5%). Comforting also to have 10 years of income covered by 'safe' Gilts and portfolio diversity of domestic stocks, foreign stocks, bonds.
Note : Both of the above images are 'thumbnail' images, so typically you might right mouse click on the image and select Open Image in new Tab, and then perhaps repeat that again for a larger view. Or just mouse click on them.
Calendar years
I like to benchmark to TJH HYP accumulation, I use end of March monthly data (in being around the start/end of fiscal years you can selectively rebalance in the old financial year, new financial year, or a combination of both according to whatever might be the more tax efficient), Terry uses actual fiscal years (April 5th) so there's some slight misalignment in individual years but that broadly washes over time.
Concept : If you loaded the third in Gilt holdings as monthly 12 overlapping 10 year gilt ladders i.e. one 10 year gilt matures every month, then that's on average 3.3% of the portfolio value each month being dumped into cash (a single Gilt holding matures each month). Spend that (as your monthly 'wage') and buy another 10 year Gilt with 3.3% of the portfolio value at that time.
Somewhat like a 3.3% SWR approach, but that would tend to see variations in how much £££ was loaded into each 'rung', so not a precise inflation adjusted income as per SWR where you scale up a fixed income amount by inflation and draw that amount, however where the general tendency would be to see income rise ahead of inflation over time. Over the long term (century+) of historic outcome that 3.3% SWR was a PWR (perpetual withdrawal rate) and the broad average was to see income rise at 3.5% ahead of inflation (rising income over time averaged inflation + 3.5%). Comforting also to have 10 years of income covered by 'safe' Gilts and portfolio diversity of domestic stocks, foreign stocks, bonds.
Note : Both of the above images are 'thumbnail' images, so typically you might right mouse click on the image and select Open Image in new Tab, and then perhaps repeat that again for a larger view. Or just mouse click on them.