Centre for evdence based medicine (Oxford):
https://www.cebm.net/covid-19/the-innac ... ge-models/
King' research by Tim Spector:
https://covid.joinzoe.com/post/covid-ra ... ot-surging
these two respectable groups have data which leads them to disagree with Sage
Got a credit card? use our Credit Card & Finance Calculators
Thanks to Rhyd6,eyeball08,Wondergirly,bofh,johnstevens77, for Donating to support the site
Coronavirus - Modelling Aspects Only
Forum rules
This is the home for all non-political Coronavirus (Covid-19) discussions on The Lemon Fool
This is the home for all non-political Coronavirus (Covid-19) discussions on The Lemon Fool
-
servodude
- Lemon Half
- Posts: 8407
- Joined: November 8th, 2016, 5:56 am
- Has thanked: 4486 times
- Been thanked: 3616 times
Re: Coronavirus - Modelling Aspects Only
Moderator Message:
Edited to remove earlier off topic discussion.
On topic part remains...
Gryffron
Edited to remove earlier off topic discussion.
On topic part remains...
Gryffron
I hadn't actually looked at weekly deaths as a series
so from: https://coronavirus.data.gov.uk/details/deaths
going back 8 weeks
Code: Select all
Date   Week   Covid Deaths Registered
04-09-2020   0   83
11-09-2020   1   110
18-09-2020   2   158
25-09-2020   3   234
02-10-2020   4   343
09-10-2020   5   474
16-10-2020   6   761
23-10-2020   7   1,126
quick plot, fit and extrapolate

- yes it's not perfect the R^2 of the fit is only 0.998
now hopefully this will be pulled in quickly by the measures recently taken ( or one of the fairies that slows a pandemic )
- but to do nothing in the face of that kind of growth is probably not acceptable ?
incidentally we have far fewer points in this series for the firstwave prior to lockdown
they would be
Code: Select all
5 114 607 3,801 6,888with a fit of 144e^0.991 so a doubling time of 0.700 weeks vs the current 1.791 weeks
- which would mean this series was growing 2.559 times faster back then
- sd
-
scotia
- Lemon Quarter
- Posts: 3566
- Joined: November 4th, 2016, 8:43 pm
- Has thanked: 2376 times
- Been thanked: 1947 times
Re: Coronavirus - Modelling Aspects Only
servodude wrote:
( or one of the fairies that slows a pandemic )
I also have been sorely tempted to use such language
I have been working on modelling a few simple death rate scenarios, based on the possible effects of the latest lockdowns. I'll tidy them up and post them tomorrow.
-
servodude
- Lemon Half
- Posts: 8407
- Joined: November 8th, 2016, 5:56 am
- Has thanked: 4486 times
- Been thanked: 3616 times
Re: Coronavirus - Modelling Aspects Only
scotia wrote:servodude wrote:
( or one of the fairies that slows a pandemic )
I also have been sorely tempted to use such language
..at this stage I think we should take all the help we can get!
- sd
-
GoSeigen
- Lemon Quarter
- Posts: 4425
- Joined: November 8th, 2016, 11:14 pm
- Has thanked: 1610 times
- Been thanked: 1603 times
Re: Coronavirus - Modelling Aspects Only
servodude wrote:
- which would mean this series was growing 2.559 times faster back then
- sd
Precisely. And that's geometric growth.
GS
-
servodude
- Lemon Half
- Posts: 8407
- Joined: November 8th, 2016, 5:56 am
- Has thanked: 4486 times
- Been thanked: 3616 times
Re: Coronavirus - Modelling Aspects Only
GoSeigen wrote:servodude wrote:
- which would mean this series was growing 2.559 times faster back then
- sd
Precisely. And that's geometric growth.
GS
Yes. They both are geometric growths with different rates (one 2.6x bigger); did you mean something else earlier when you said 10x?
-sd
-
scotview
- Lemon Quarter
- Posts: 1503
- Joined: November 5th, 2016, 9:00 am
- Has thanked: 607 times
- Been thanked: 918 times
Re: Coronavirus - Modelling Aspects Only
Just a note of thanks for everyone taking the time to interpret the mass of varied data and attempting to make sense of it.
Thanks.
Thanks.
-
gryffron
- Lemon Quarter
- Posts: 3640
- Joined: November 4th, 2016, 10:00 am
- Has thanked: 557 times
- Been thanked: 1616 times
Re: Coronavirus - Modelling Aspects Only
Moderator Message:
Have just removed a number of off topic posts. Please remember this thread is ONLY for mathematical modelling of the Coronavirus threat.
General opinions can be posted on the Snug Thread.
Political discussion on Polite Discussions
Please keep everything in it's place. All the threads are long and complicated enough as it is.
Thanks,
Gryffron
-
scotia
- Lemon Quarter
- Posts: 3566
- Joined: November 4th, 2016, 8:43 pm
- Has thanked: 2376 times
- Been thanked: 1947 times
Re: Coronavirus - Modelling Aspects Only
I have been attempting to forecast the English Covid-19 death rate in response to the new lockdown rules. Due to the delay between infection and related deaths, the restrictions introduced on the 5th November are unlikely to affect the current upward path of deaths until around the 12th November (the first section). However by around the 20th November the lockdown effect should be reasonably complete in its (hopefully) downward effect on deaths (the final section). So looking at November – the first 11 days (first section) will follow an exponential upwards curve (as currently), and from 20th (final section) it will follow an exponential curve downwards. From the 12th to the 19th (middle section) I have modelled a smooth transition by linearly extrapolating the exponential growth factor between its two end points. I have also extended the final section onward until the 11th December, since it seems unlikely that any future changes as may occur around the end of the month will have much effect in that period.

As shown, I have looked at three scenarios. By inspecting the data I have previously plotted, I have assumed that a 14 day doubling time is a reasonable choice for the first section. I looked at the graphs of the falling death rate in the April lockdown, and concluded that a a 14 day halving rate was reasonable for the final section..
For a “better” scenario, I used 17 day doubling for the first section, and 11 day halving in the final section.
For a “worse” scenario I used a 11 day doubling for the first section, and 17 day halving in the final section.
The final values at 11th December may seem disappointingly large for all the effort of lockdown. However if the initial 14 day doubling rate had continued uninterrupted, its final value at 11th December would be 7.24. To obtain the daily death rates from these plotted ratios, you should multiply with the “averaged” daily death rate at 1st November – around 200 to 250.
-
GoSeigen
- Lemon Quarter
- Posts: 4425
- Joined: November 8th, 2016, 11:14 pm
- Has thanked: 1610 times
- Been thanked: 1603 times
Re: Coronavirus - Modelling Aspects Only
servodude wrote:GoSeigen wrote:servodude wrote:
- which would mean this series was growing 2.559 times faster back then
- sd
Precisely. And that's geometric growth.
GS
Yes. They both are geometric growths with different rates (one 2.6x bigger); did you mean something else earlier when you said 10x?
-sd
Someone here took offence at my offering a differing opinion, I think you guys can enjoy your own little discussion group.
GS
-
servodude
- Lemon Half
- Posts: 8407
- Joined: November 8th, 2016, 5:56 am
- Has thanked: 4486 times
- Been thanked: 3616 times
Re: Coronavirus - Modelling Aspects Only
GoSeigen wrote:servodude wrote:GoSeigen wrote:
Precisely. And that's geometric growth.
GS
Yes. They both are geometric growths with different rates (one 2.6x bigger); did you mean something else earlier when you said 10x?
-sd
Someone here took offence at my offering a differing opinion, I think you guys can enjoy your own little discussion group.
GS
I don't think anyone meant any offence (I know I didn't)
It's just that there's been some effort in bits of this thread to try and make sense of and interpret the data available.
I'm sure you'll agree that 10x is quite a bit bigger than 2.6x
- so either I've calculated it completely incorrectly (which is hopefully something you could point out from the working)
- or perhaps it's not as different from the first wave as you might have thought?
-sd
-
bruncher
- Lemon Quarter
- Posts: 1188
- Joined: November 4th, 2016, 12:20 pm
- Has thanked: 319 times
- Been thanked: 305 times
Re: Coronavirus - Modelling Aspects Only
modellingman wrote:bruncher wrote:zico wrote:Just a brief reminder about keeping this thread on topic to discussions about modelling and data, and avoiding getting into potentially political arguments about opposing views - it's easy to get sidetracked, and I'm probably as guilty as anyone.
Anyway, right back on topic, here's a link to the latest ONS mortality statistics on Covid-19 by ethnic groups.
The summary report is clear & easy to read, but here's my summary and take on the main findings.
Black and Asian people have 4 times the White death rate, reducing to 1.9 when adjusted for age, demographics and underlying health.
ONS study doesn't correct for occupation type - seems intuitively likely that this factor could explain much of the difference, as London NHS and care homes and other public-facing jobs likely to have a higher proportion of BAME staff than most other occupations - but that's just my theory, unsupported by proper data.
ONS shows Chinese people have a very similar death rate to White people. This is important because it means the stats from China (if they can be trusted) will apply equally to the White ethnic group.
https://www.ons.gov.uk/peoplepopulation ... 0april2020
The figures for difference between 'white' and 'BAME' given in the press is up to X4 difference, but there's often a conflation of "more likely to contract Covid-19" and "more likely to die from Covid-19 when infected".
The issue is increasingly taken up in politics, hence the importance of understanding what is going on, as some groups understandably claim they need special protection.
What I have not seen in any modelling is any recognition of the potential differences in the way different ethnic/cultural groups have responded to the Government's instructions for social isolation during lockdown, which I feel could be significant just as I agree that occupation is going to be a major factor.
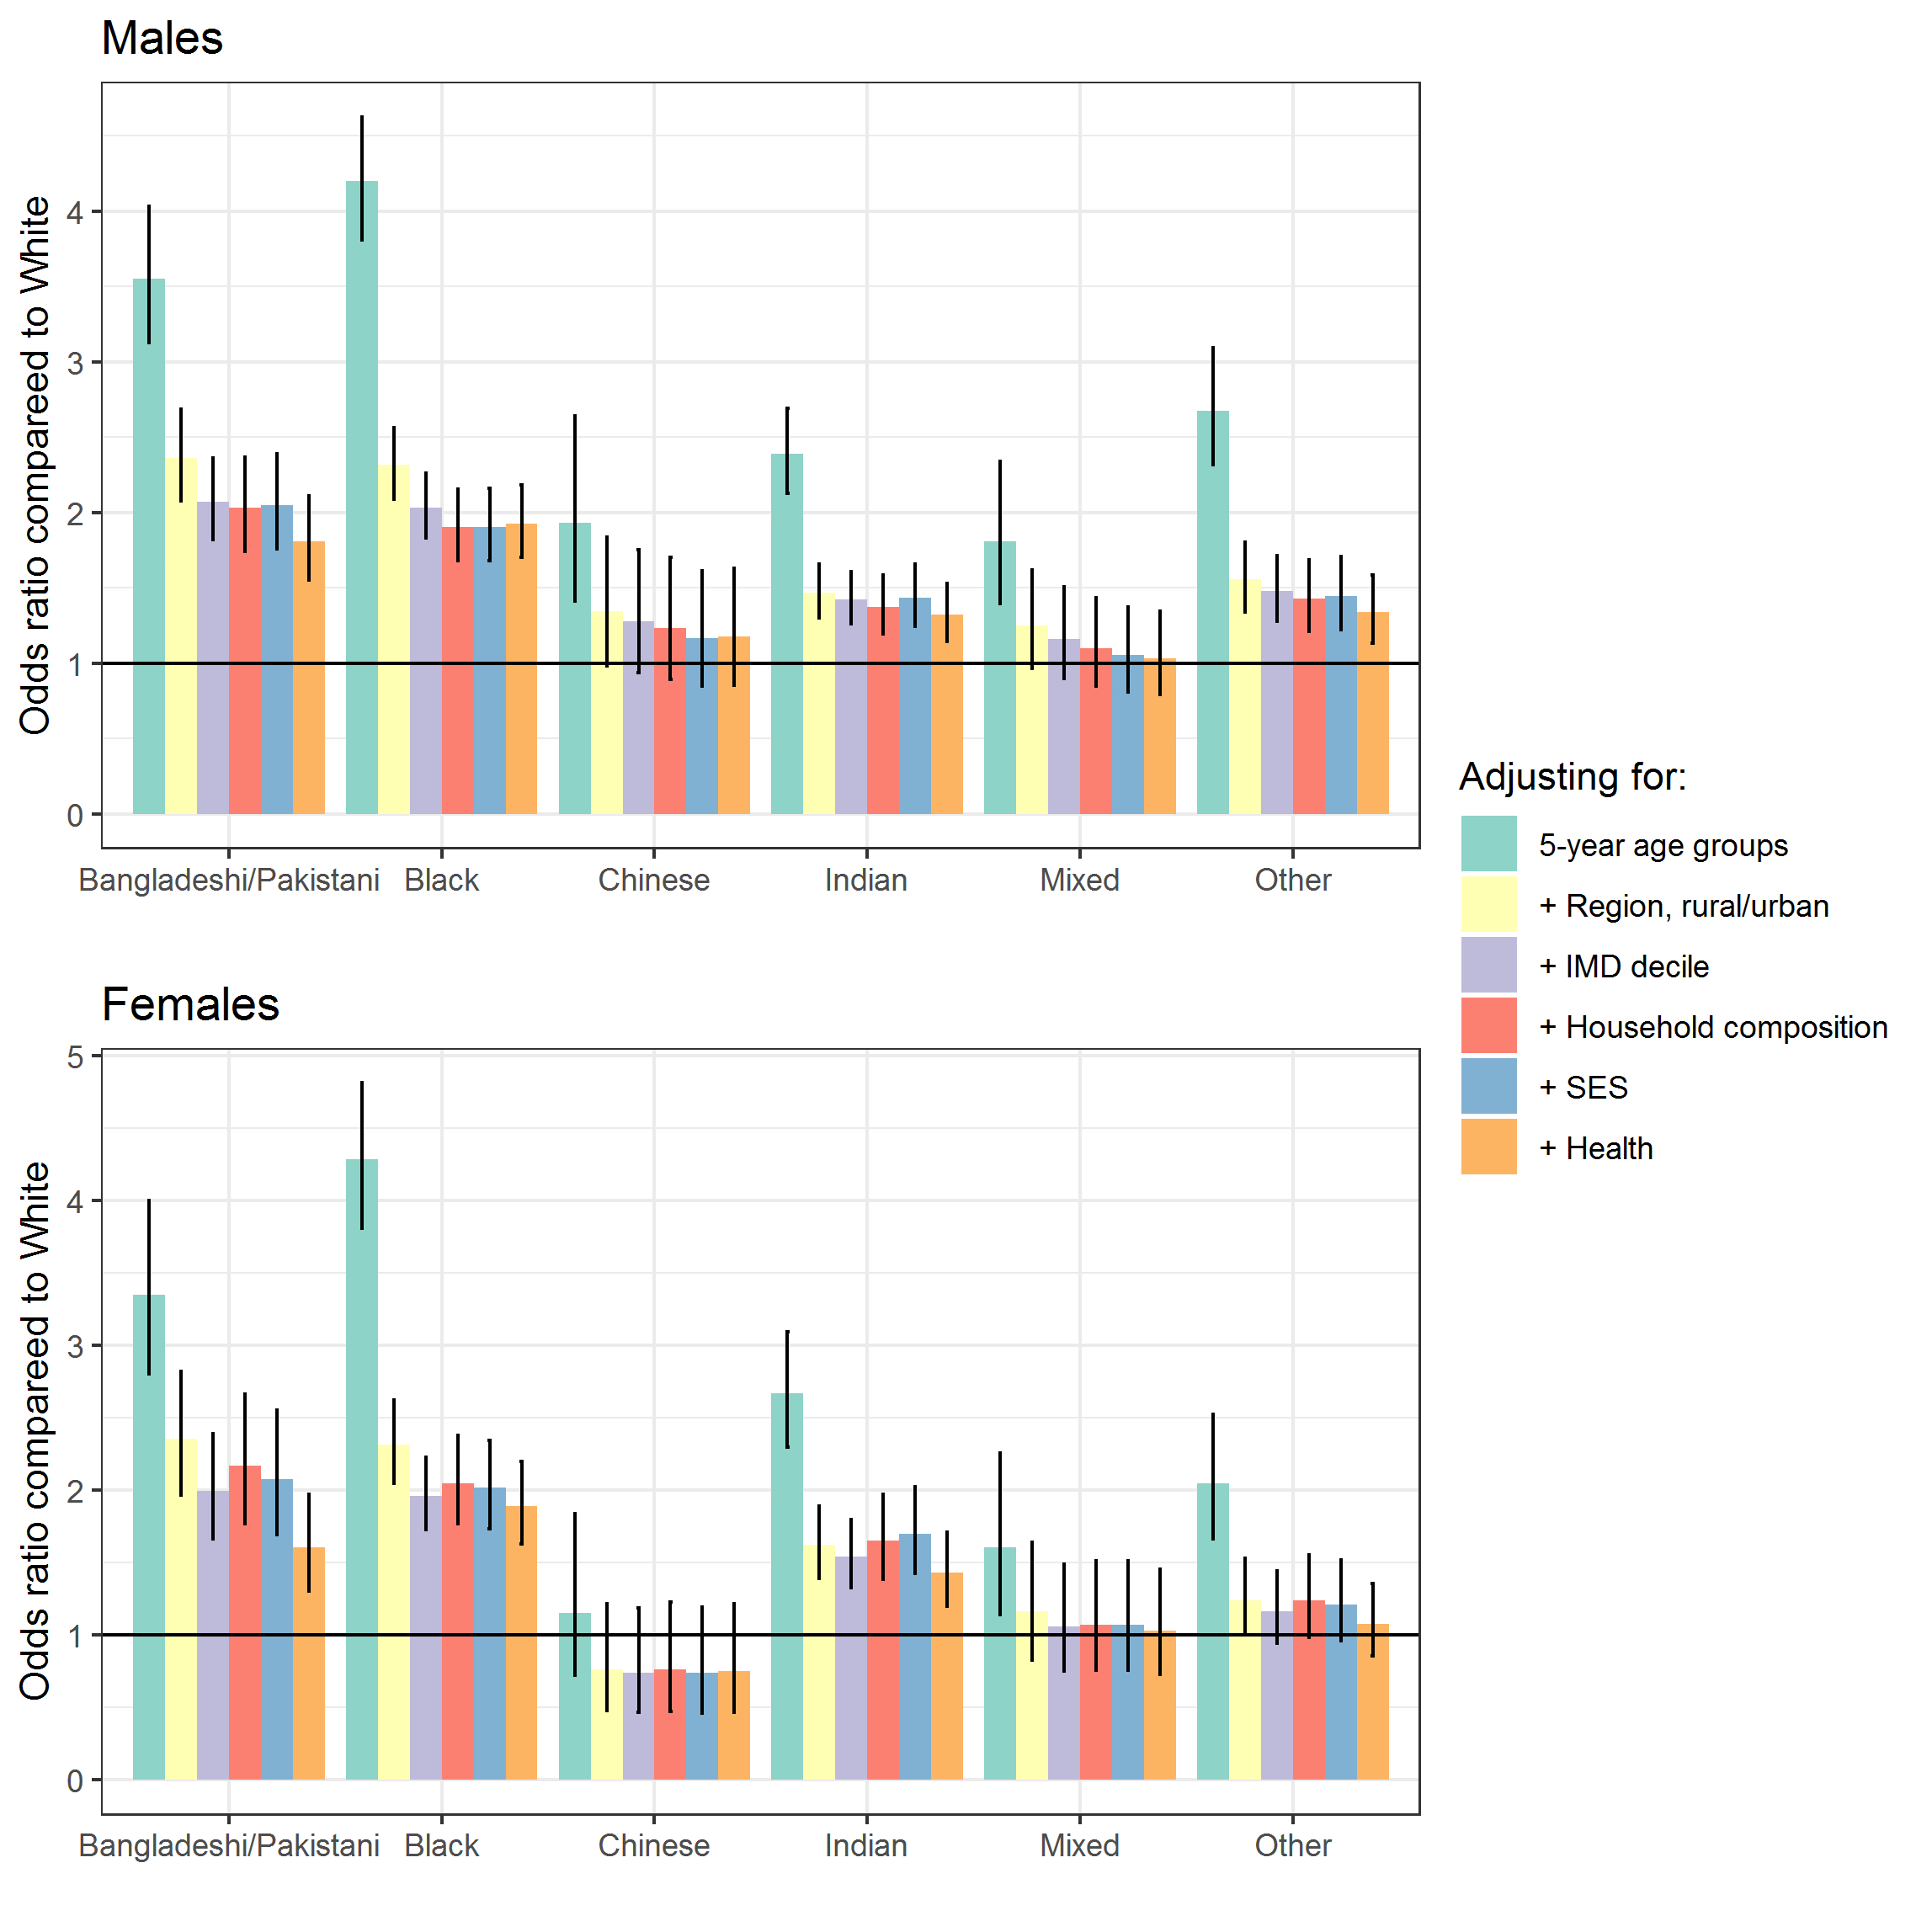
Whilst I agree with zico's comments about the study being easy to read, it is section 4 of the technical appendix ( https://www.ons.gov.uk/peoplepopulation ... ethodology ) which contains the detailed results. These are presented in the form of two charts separately for males and females and show the "odds ratio" for the likelihood of death for specific ethnic groups compared to the White ethnic group. Death in these circumstances is defined as death from/with Covid-19 in the 6 week study period to 10 April 2020. Courtesy OGL, the charts are shown below.
The study attempts to correct for a variety of factors that are known to have a general influence on mortality from Covid-19. If an ethnic group is over-represented at the unfavourable end of the scale for a particular factor (or under-represented at the favourable end) the modelling approach adjusts the mortality measure to account for this. After adjusting for all 6 factors, Blacks had a mortality rate greater than Whites by a factor of 1.93 for males and 1.89 for females. For Bangladeshi/Pakistani people the factors reduce to 1.81 (males) and 1.61 (females). For males the factors decline across the ethnic groups in order Other(1.34), Indian(1.32), Chinese(1.18) and Mixed(1.03). For females it is Indian (1.43), Other(1.08), MIxed(1.03) and Chinese(0.75).
I remain to be convinced about arguments related to occupation type, simply because the White group numerically dominates the statistics. For example, this source ( https://www.ethnicity-facts-figures.ser ... rce/latest ) suggests that whilst Whites are under-represented in the NHS the numbers are still very large at 79.2% of the NHS workforce compared to 85.6% of the working age population. The largest ethnic group from this source is Asian and comprises 10% of the NHS workforce compared to 7.2% of the working age population. Blacks in the same terms are 6.1% of the NHS and 3.4% of the WA population. There are some caveats of course, the working age population is based on the 2011 census (as is much of the ONS study data) whilst the NHS figures are from March 2019. There are, as zico notes,other occupational groups (such as care home workers) that might be important. The ONS technical appendix notes that the Bangladeshi/Pakistani ethnic group is by far the biggest ethnic group in the transport and drivers and operatives standard occupational classification sub-major group, which encompasses bus, coach and taxi drivers and those driving other types of industrial and agricultural vehicles, though takes this observation no further in the analysis (probably because of data limitations).
In terms of Bruncher's remarks, elements of the press and some politicians have jumped on the "4 times as likely" headline. Bruncher himself raised this on Polite Discussions a while ago and received these modelling related responses from ursaminotaur and myself
https://lemonfool.co.uk/viewtopic.php?f ... 60#p318231
https://lemonfool.co.uk/viewtopic.php?f ... 60#p318252
https://lemonfool.co.uk/viewtopic.php?f ... 80#p318722
The suggestion of a differential response across ethnic groups is an interesting one I have not seen elsewhere. The lack of modelling is, I suspect, due to a paucity of data on which to base appropriate models. Other hypotheses are based around Vitamin D, and again from Polite Discussions there is relevant comment here:
https://lemonfool.co.uk/viewtopic.php?f ... 00#p319202
and in the following few posts.
New report - BBC "Black people 'twice as likely to catch coronavirus'"
https://www.bbc.co.uk/news/health-54907473
As far as I can see from a brief read, the study does not look at what is, to me, the obvious thing to look at which is varying attitudes to mainstream news, government announcements etc by different groups. To be blunt - if you have a history (e.g. slavery) of being screwed over by the ruling class, then would you be listening to them and following their instructions?
-
dealtn
- Lemon Half
- Posts: 6099
- Joined: November 21st, 2016, 4:26 pm
- Has thanked: 443 times
- Been thanked: 2344 times
Re: Coronavirus - Modelling Aspects Only
bruncher wrote:
As far as I can see from a brief read, the study does not look at what is, to me, the obvious thing to look at which is varying attitudes to mainstream news, government announcements etc by different groups. To be blunt - if you have a history (e.g. slavery) of being screwed over by the ruling class, then would you be listening to them and following their instructions?
You think that's the most obvious cause?
Remind me when did slavery end again, and how involved were the UK authorities and mainstream media in the widely known about Asian slave trade?
-
modellingman
- Lemon Slice
- Posts: 621
- Joined: November 4th, 2016, 3:46 pm
- Has thanked: 608 times
- Been thanked: 368 times
Re: Coronavirus - Modelling Aspects Only
bruncher wrote:
New report - BBC "Black people 'twice as likely to catch coronavirus'"
https://www.bbc.co.uk/news/health-54907473
As far as I can see from a brief read, the study does not look at what is, to me, the obvious thing to look at which is varying attitudes to mainstream news, government announcements etc by different groups. To be blunt - if you have a history (e.g. slavery) of being screwed over by the ruling class, then would you be listening to them and following their instructions?
According to the BBC article, the researchers at the universities of Leicester and Nottingham looked at data from eight UK and 42 US studies so I suspect there wasn't sufficient (or any) behavioral data collected in these studies to allow testing of the type of hypothesis that you have proposed.
-
johnhemming
- Lemon Quarter
- Posts: 3858
- Joined: November 8th, 2016, 7:13 pm
- Has thanked: 9 times
- Been thanked: 609 times
Re: Coronavirus - Modelling Aspects Only
There are two potential medical reasons
a) Vitamin D
b) ACE2 cells.
a) Vitamin D
b) ACE2 cells.
-
funduffer
- Lemon Quarter
- Posts: 1338
- Joined: November 4th, 2016, 12:11 pm
- Has thanked: 123 times
- Been thanked: 848 times
Re: Coronavirus - Modelling Aspects Only
johnhemming wrote:There are two potential medical reasons
a) Vitamin D
b) ACE2 cells.
The Vitamin D point could turn out to be very important.
My GP sister in law told me I should take vitamin D over the winter, even if I go outside a lot. She, working as a GP, took a test and found her Vitamin D levels were way down, so she advises white people to take it in the winter, and darker coloured people to take it all the year around.
Not sure there has been a definitive clinical trial on low vitamin D v Covid severity, but I think there is a correlation that needs to be explained.
FD
-
johnhemming
- Lemon Quarter
- Posts: 3858
- Joined: November 8th, 2016, 7:13 pm
- Has thanked: 9 times
- Been thanked: 609 times
Re: Coronavirus - Modelling Aspects Only
funduffer wrote:My GP sister in law told me I should take vitamin D over the winter, even if I go outside a lot. She, working as a GP, took a test and found her Vitamin D levels were way down, so she advises white people to take it in the winter, and darker coloured people to take it all the year around.
One of my black friends who I give advice on supplements to was told twice by different GPs that they had never seen such good vitamin D levels.
-
vrdiver
- Lemon Quarter
- Posts: 2574
- Joined: November 5th, 2016, 2:22 am
- Has thanked: 552 times
- Been thanked: 1212 times
Re: Coronavirus - Modelling Aspects Only
johnhemming wrote:funduffer wrote:My GP sister in law told me I should take vitamin D over the winter, even if I go outside a lot. She, working as a GP, took a test and found her Vitamin D levels were way down, so she advises white people to take it in the winter, and darker coloured people to take it all the year around.
One of my black friends who I give advice on supplements to was told twice by different GPs that they had never seen such good vitamin D levels.
and their vitamin D levels were good despite their skin colour or because they take supplements?
If the former, are you suggesting there isn't really a problem with vitamin D levels in certain ethnic groups, or is there some other explanation at hand (diet, lifestyle, etc.)?
-
johnhemming
- Lemon Quarter
- Posts: 3858
- Joined: November 8th, 2016, 7:13 pm
- Has thanked: 9 times
- Been thanked: 609 times
Re: Coronavirus - Modelling Aspects Only
vrdiver wrote:and their vitamin D levels were good despite their skin colour or because they take supplements?
I give advice on supplements including D3. The levels were good because they follow my advice. I generally recommend 3000iu a day, but I think that can be too much in the long term if people are white and not obese.
Hence what I am saying is that the doctors though the outcome from my advice was good.
-
funduffer
- Lemon Quarter
- Posts: 1338
- Joined: November 4th, 2016, 12:11 pm
- Has thanked: 123 times
- Been thanked: 848 times
Re: Coronavirus - Modelling Aspects Only
johnhemming wrote:vrdiver wrote:and their vitamin D levels were good despite their skin colour or because they take supplements?
I give advice on supplements including D3. The levels were good because they follow my advice. I generally recommend 3000iu a day, but I think that can be too much in the long term if people are white and not obese.
Hence what I am saying is that the doctors though the outcome from my advice was good.
I just follow advice from the NHS (as given by my Sister-in-law GP):
https://www.nhs.uk/conditions/vitamins- ... vitamin-d/
I.e. 10mg (400IU) per day.
Return to “Coronavirus Discussions”
Who is online
Users browsing this forum: No registered users and 22 guests