Page 33 of 68
Re: Coronavirus - Modelling Aspects Only
Posted: July 4th, 2020, 12:10 pm
by Alaric
redsturgeon wrote:I hope you are correct but how do we explain the Leicester blip?
Extra cases could be caused by more intensive testing. It's serious cases, as measured by hospital admissions or fatalities that would be the evidence of a dangerous spreading infection.
Re: Coronavirus - Modelling Aspects Only
Posted: July 4th, 2020, 1:28 pm
by Mike4
redsturgeon wrote:1nvest wrote:My by-eye casual guesstimate is that perhaps 29 million of the UK population may already have had it (43% of the population). ONS figures ...

which might explain why crowded beaches/parks and mass protests hasn't seen a sharp number of hospital admissions.
i.e. Government under-reported number of Covid deaths (around half the number reported as having died), so 80,000 deaths / 0.0028 Crude Mortality Rate type figure as a indicator of total number of contractions. Broadly 10,000/week die in the UK and the area above that average in the chart above seems to suggest a 80,000 additional (above average) number.
In which case pubs/restaurants opening this weekend may similarly see subsequent hospital admissions remaining low. At least here's hoping so. If the rest contract it before the winter/flu season, then we could be coming out of the woods and be back to normal again before the end of the year.
US seems to be behind on that scale. Proportionately reporting around 60% of the number of UK deaths, so presumably still on the steep part of the herd immunity transition curve. Yet others that have kept figures right down may still see the same proportion of deaths overall by the time herd immunity is evident, but where they'll be in repeated lockdown/openup/lockdown cycles for much longer, and enduring the more prolonged economic hit that involves. Could still all end with the UK having been seen to have taken the best approach - and is perhaps why Johnson has said that its the final outcome that we should be measured by rather that the ongoing interim numbers.
I hope you are correct but how do we explain the Leicester blip?
John
Is there really a Leicester blip though? Friend of mine was trying to find data by city to verify it and couldn't. Can you cite some data please?
Re: Coronavirus - Modelling Aspects Only
Posted: July 4th, 2020, 2:03 pm
by redsturgeon
Mike4 wrote:redsturgeon wrote:1nvest wrote:My by-eye casual guesstimate is that perhaps 29 million of the UK population may already have had it (43% of the population). ONS figures ...
which might explain why crowded beaches/parks and mass protests hasn't seen a sharp number of hospital admissions.
i.e. Government under-reported number of Covid deaths (around half the number reported as having died), so 80,000 deaths / 0.0028 Crude Mortality Rate type figure as a indicator of total number of contractions. Broadly 10,000/week die in the UK and the area above that average in the chart above seems to suggest a 80,000 additional (above average) number.
In which case pubs/restaurants opening this weekend may similarly see subsequent hospital admissions remaining low. At least here's hoping so. If the rest contract it before the winter/flu season, then we could be coming out of the woods and be back to normal again before the end of the year.
US seems to be behind on that scale. Proportionately reporting around 60% of the number of UK deaths, so presumably still on the steep part of the herd immunity transition curve. Yet others that have kept figures right down may still see the same proportion of deaths overall by the time herd immunity is evident, but where they'll be in repeated lockdown/openup/lockdown cycles for much longer, and enduring the more prolonged economic hit that involves. Could still all end with the UK having been seen to have taken the best approach - and is perhaps why Johnson has said that its the final outcome that we should be measured by rather that the ongoing interim numbers.
I hope you are correct but how do we explain the Leicester blip?
John
Is there really a Leicester blip though? Friend of mine was trying to find data by city to verify it and couldn't. Can you cite some data please?
https://www.bbc.co.uk/news/uk-england-l ... e-53229371John
Re: Coronavirus - Modelling Aspects Only
Posted: July 4th, 2020, 2:25 pm
by Mike4
Mike4 wrote:
Is there really a Leicester blip though? Friend of mine was trying to find data by city to verify it and couldn't. Can you cite some data please?
Thanks, some fairly convincing statistics quoted in that BBC article.
No source attribution provided though AFAICS, which is disappointing. Do you have any idea what source they are quoting from? I guess I was hoping to be able to look at the comparable data for other cities.
Re: Coronavirus - Modelling Aspects Only
Posted: July 4th, 2020, 2:38 pm
by Alaric
Mike4 wrote:.
No source attribution provided though AFAICS, which is disappointing. Do you have any idea what source they are quoting from? I guess I was hoping to be able to look at the comparable data for other cities.
Presumably the ONS (Office for National Statistics)
https://www.ons.gov.uk/peoplepopulation ... r=datasetsThat gives statistics by region, presumably they also have detail by local authority.
Re: Coronavirus - Modelling Aspects Only
Posted: July 4th, 2020, 3:33 pm
by Mike4
Alaric wrote:Mike4 wrote:.
No source attribution provided though AFAICS, which is disappointing. Do you have any idea what source they are quoting from? I guess I was hoping to be able to look at the comparable data for other cities.
Presumably the ONS (Office for National Statistics)
https://www.ons.gov.uk/peoplepopulation ... r=datasetsThat gives statistics by region,
presumably they also have detail by local authority.
One would have thought so. Deaths perhaps, but no local infection statistics AFAICS.
It's beginning to look as though my friend who asserts the govt have taken down all the infections by local area e.g. Leicester, is right.
Re: Coronavirus - Modelling Aspects Only
Posted: July 4th, 2020, 4:25 pm
by Nimrod103
Mike4 wrote:Alaric wrote:Mike4 wrote:.
No source attribution provided though AFAICS, which is disappointing. Do you have any idea what source they are quoting from? I guess I was hoping to be able to look at the comparable data for other cities.
Presumably the ONS (Office for National Statistics)
https://www.ons.gov.uk/peoplepopulation ... r=datasetsThat gives statistics by region,
presumably they also have detail by local authority.
One would have thought so. Deaths perhaps, but no local infection statistics AFAICS.
It's beginning to look as though my friend who asserts the govt have taken down all the infections by local area e.g. Leicester, is right.
I occasionally read another site:
https://www.housepricecrash.co.uk/forum ... 1103597820See the post on page 800, at Wedensday 15.52
Sourced from the Leicester Mercury. The graph title suggests this is only Leicester data.
The new spike is in Pillar 2 tests, which have not generally been made public. And generally represent less serious infections of younger people, not requiring hospital treatment. Whether this is genuinely a new spike, or just a ramp up in testing, only PHE knows. Their response suggests this is a new spike of infections.
Re: Coronavirus - Modelling Aspects Only
Posted: July 4th, 2020, 4:29 pm
by 1nvest
redsturgeon wrote:1nvest wrote:My by-eye casual guesstimate is that perhaps 29 million of the UK population may already have had it (43% of the population). ONS figures ...
which might explain why crowded beaches/parks and mass protests hasn't seen a sharp number of hospital admissions.
i.e. Government under-reported number of Covid deaths (around half the number reported as having died), so 80,000 deaths / 0.0028 Crude Mortality Rate type figure as a indicator of total number of contractions. Broadly 10,000/week die in the UK and the area above that average in the chart above seems to suggest a 80,000 additional (above average) number.
In which case pubs/restaurants opening this weekend may similarly see subsequent hospital admissions remaining low. At least here's hoping so. If the rest contract it before the winter/flu season, then we could be coming out of the woods and be back to normal again before the end of the year.
US seems to be behind on that scale. Proportionately reporting around 60% of the number of UK deaths, so presumably still on the steep part of the herd immunity transition curve. Yet others that have kept figures right down may still see the same proportion of deaths overall by the time herd immunity is evident, but where they'll be in repeated lockdown/openup/lockdown cycles for much longer, and enduring the more prolonged economic hit that involves. Could still all end with the UK having been seen to have taken the best approach - and is perhaps why Johnson has said that its the final outcome that we should be measured by rather that the ongoing interim numbers.
I hope you are correct but how do we explain the Leicester blip?
John
With say 29 million having had it, that's still 35 million that haven't, so the spread would still do its thing and rage in some areas, not others. Culture/lifestyle maybe. Ramadan perhaps. My (SE residential) neighbours who are Muslim have had many different faces coming and going as though lockdown didn't exist.
I guess with a long way to go (maybe up to 35 million yet to contract it), a second wave might repeat the first wave, but to less magnitude - half the size of the first wave), and then a third wave half the size of the second ...etc.
I believe that the large Nightingale centres were little used, so hospitalisation capacity is vastly improved, as is there better understanding/treatments. If 10,000/week on average die in the UK then the current numbers of Covid mortalities are very low relative to that. Still of course sad for each individual case, but not enough to shut down the economy and the potential risks/costs that involves. Suspect that by the time its pretty much concluded the official figures might be reporting 80,000 deaths, actual figures perhaps twice that. Primary risks as I see it are that immunity is short lived, and/or if it evolves into a far deadlier strain as the Spanish flu did (low single digit first wave mortality rates, 30%+ second wave mortality rates). On the flip side, a vaccine might be found.
Re: Coronavirus - Modelling Aspects Only
Posted: July 4th, 2020, 4:42 pm
by redsturgeon
Latest on Leicester show top ten cities with most cases
https://www.bbc.co.uk/news/uk-england-l ... e-53290314John
Re: Coronavirus - Modelling Aspects Only
Posted: July 4th, 2020, 4:59 pm
by dealtn
Am I reading that data correctly?
So the 10th "worst" area has less than 25 new cases in the week ending 27th June per 100,000. That's less than 0.025%, or less than 1/40th of a percent.
To put that in perspective about 600 per 100,000 will get cancer each year across the UK, so about 12 per week.
Now obviously without "common sense" this can get worse (and indeed 2 out of that "worst 10" did get "worse" than the week before), but that strikes me as a very low level of infection now. No wonder lockdown is easing.
Re: Coronavirus - Modelling Aspects Only
Posted: July 9th, 2020, 7:10 pm
by johnhemming
The government appear to be now publishing daily hospital admissions on an almost timely basis.
https://coronavirus-staging.data.gov.uk/healthcareThe last day for admissions is 2nd July.
In many ways this the most reliable and timely statistic as it will tend to indicate the levels of infection about 2 weeks before admission.
Re: Coronavirus - Modelling Aspects Only
Posted: July 9th, 2020, 8:57 pm
by swill453
GoSeigen wrote:swill453 wrote:GoSeigen wrote:by GoSeigen » June 7th, 2020
I think there's a new acceleration happening now... looking at 12000 deaths pd within two to three weeks time IMO.
The deaths pd hasn't broken out of the 2000-6000 range for more than 30 days now. Yesterday standing at 4281. Still sticking by this prediction?
Not sure about the timing but it looks like cases are growing, so yes, I think so.
Worldwide covid cases do (or at least did until quite recently) still seem to be increasing, yet the death rate has stayed stubbornly within a range of about 2000 to 6000 (maybe 7000) deaths per day for about the last 2 months, not really looking like breaking out.
Do we think this is some kind of ceiling? Or is it suffering from under-reporting?
(Well of course it's bound to be under-reported, but is it any more so than, say, 3 months ago?)
Scott.
Re: Coronavirus - Modelling Aspects Only
Posted: July 10th, 2020, 8:17 am
by GoSeigen
swill453 wrote:GoSeigen wrote:swill453 wrote:The deaths pd hasn't broken out of the 2000-6000 range for more than 30 days now. Yesterday standing at 4281. Still sticking by this prediction?
Not sure about the timing but it looks like cases are growing, so yes, I think so.
Worldwide covid cases do (or at least did until quite recently) still seem to be increasing, yet the death rate has stayed stubbornly within a range of about 2000 to 6000 (maybe 7000) deaths per day for about the last 2 months, not really looking like breaking out.
Do we think this is some kind of ceiling? Or is it suffering from under-reporting?
(Well of course it's bound to be under-reported, but is it any more so than, say, 3 months ago?)
Scott.
Yes, I'm finding that very curious too. To date I've not come to any conclusion about reasons but I can't deny that deaths are far lower than I expected given the rapidly increasing case numbers.
I'm glad you're watching this too; it would be good to find some solid research or figures which explain this. One point that can be made I think is that the bulk of new cases are now in developing countries, rather than developed countries as earlier. So is the lower death rate because of worse health care in those countries such that they don't have a vulnerable old-age population? IOW, perhaps developed countries have kept alive a swath of old people who have been cut down by the virus? That theory doesn't really work well for places like Japan though, which has an old population but few deaths.
GS
Re: Coronavirus - Modelling Aspects Only
Posted: July 10th, 2020, 8:34 am
by Bubblesofearth
GoSeigen wrote:Yes, I'm finding that very curious too. To date I've not come to any conclusion about reasons but I can't deny that deaths are far lower than I expected given the rapidly increasing case numbers.
I'm glad you're watching this too; it would be good to find some solid research or figures which explain this. One point that can be made I think is that the bulk of new cases are now in developing countries, rather than developed countries as earlier. So is the lower death rate because of worse health care in those countries such that they don't have a vulnerable old-age population? IOW, perhaps developed countries have kept alive a swath of old people who have been cut down by the virus? That theory doesn't really work well for places like Japan though, which has an old population but few deaths.
GS
Even Trump managed to latch on to the fact that if you test more people you find more cases

Re: Coronavirus - Modelling Aspects Only
Posted: July 10th, 2020, 8:51 am
by johnhemming
The most timely measure of trends is hospital admissions. Test numbers can only be used when statistically relevant which is rare.
Re: Coronavirus - Modelling Aspects Only
Posted: July 12th, 2020, 8:51 am
by johnhemming
https://www.medrxiv.org/content/10.1101 ... 3.full.pdfWe integrate
continuous distributions of susceptibility or connectivity in otherwise basic epidemic models for
COVID-19 and show that as the coefficient of variation (CV) increases from 0 to 4, the herd
20 immunity threshold declines from over 60% (4, 5) to less than 10%. Measures of individual
variation are urgently needed to narrow the estimated ranges of HITs and plan accordingly.
We searched the literature for estimates of individual variation in the propensity
to acquire or transmit several infectious diseases including COVID-19 and overlaid these
estimates as vertical lines in Figure 3. CV estimates are mostly comprised between 2 and 4, a
range where naturally acquired immunity to SARS-CoV-2 may place populations over the HIT
5 once as few as 10-20% of its individuals are immune. This depends, however, on which specific
transmission traits are variable and how much the trait variants are distributed.
Re: Coronavirus - Modelling Aspects Only
Posted: July 12th, 2020, 12:14 pm
by johnhemming
Actually it is Scotland that is not publishing hospital admissions. You can see the English ones up to 8th/9th July. I think the English ones are probably not complete for 9th July.
https://coronavirus-staging.data.gov.uk ... me=EnglandThe figures on hospital admissions correlate with the hypothesis that we have essentially hit herd immunity in the urban areas.
Re: Coronavirus - Modelling Aspects Only
Posted: July 12th, 2020, 3:52 pm
by Sorcery
johnhemming wrote:https://www.medrxiv.org/content/10.1101/2020.04.27.20081893v3.full.pdf
We integrate
continuous distributions of susceptibility or connectivity in otherwise basic epidemic models for
COVID-19 and show that as the coefficient of variation (CV) increases from 0 to 4, the herd
20 immunity threshold declines from over 60% (4, 5) to less than 10%. Measures of individual
variation are urgently needed to narrow the estimated ranges of HITs and plan accordingly.
We searched the literature for estimates of individual variation in the propensity
to acquire or transmit several infectious diseases including COVID-19 and overlaid these
estimates as vertical lines in Figure 3. CV estimates are mostly comprised between 2 and 4, a
range where naturally acquired immunity to SARS-CoV-2 may place populations over the HIT
5 once as few as 10-20% of its individuals are immune. This depends, however, on which specific
transmission traits are variable and how much the trait variants are distributed.
Good to see Gomes et al getting more publicity and credit. I saw another article which was a little critical of this paper, asking the question and paraphrasing, if this is true, why doesn't it work for flu?
https://www.quantamagazine.org/the-tric ... -20200630/
Re: Coronavirus - Modelling Aspects Only
Posted: July 12th, 2020, 4:34 pm
by johnhemming
“The question is: Could New York City support another outbreak?” he said. “I don’t know, but let’s not play with that fire.”
Which approach assumes no downside to lockdowns.
Re: Coronavirus - Modelling Aspects Only
Posted: July 12th, 2020, 11:01 pm
by 1nvest
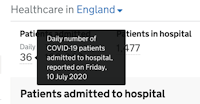
johnhemming wrote:Actually it is Scotland that is not publishing hospital admissions. You can see the English ones up to 8th/9th July. I think the English ones are probably not complete for 9th July.
https://coronavirus-staging.data.gov.uk ... me=EnglandThe figures on hospital admissions correlate with the hypothesis that we have essentially hit herd immunity in the urban areas.
36 Covid-19 hospital admissions across the whole of England on Friday 10th July
Given packed beaches, parks and street protests over the last few weeks, if it was going to spike back up again one might reasonably have expected it to already be doing so. Maybe it is very subjective to viral load, small level exposure and a snivels outcome, heavy load and uh-oh! Carers/front line NHS previously caring for many - inducing many having high loads, pushing the number of deaths upwards. Nice summer, people mostly encountering others outside in fresh air, fewer in hospital ... and its faded right down. Come the winter however !!!