DrFfybes wrote:tjh290633 wrote:If the results after all those costs are better than the trackers, they are worth having. My grandaughter's holding has given her 13.86% over the last 19 years.
TJH
2 things strike me here....
1) The last 20 years have (largely) been a bull market and low interest rates. My maths head was struggling with the figures, but if I had a leveraged fund invested in a tracker at the 2011-2021 World return of 11% (say 100k of my capital, and borrowed £10k at 2% interest) then that would also have outperformed the tracker.
2) There are a very very small number of Funds that have consistently outperformed. I agree FCIT has a long history of good returns, but even FCIT has just matched VWRL or VEVE over 3 and 5 years. Other examples are Fundsmith (15% down this year), Nick Train ('It's fine, September is a good month, things are coming back to me'), CTY (pretty stellar TR until about 7 years ago), Woodford (a man who's shine wore off as time wore on). What I don't have or can easily find is how FCIT coped with the crashes and downturns towards the end of the last decade, although it is unlikely the same people are still in charge.
I'm not saying FCIT aren't worthy of consideration, but all your eggs in one basket? - Than you get on to a selection of ITs, and as Luni's exercise shows, generally that doesn't end well.
As the old saying goes... past returns are no guarantee of future performance

Paul
Good point about the Buffett effect, near free money since the 2008/2009 financial crisis. Warren Buffett/Berkshire Hathaway has its large insurance pool of "free money", premiums paid in lieu of claims later being paid out. Great during periods of high interest rates, a distinct advantage, but from 2010 to recent and BRK that more usually was perceived as a relative outperformer has near-as just
matched the S&P500 index total return.
What I don't have or can easily find is how FCIT coped with the crashes and downturns towards the end of the last decade
Digging out the 2006 FCIT annual report within which
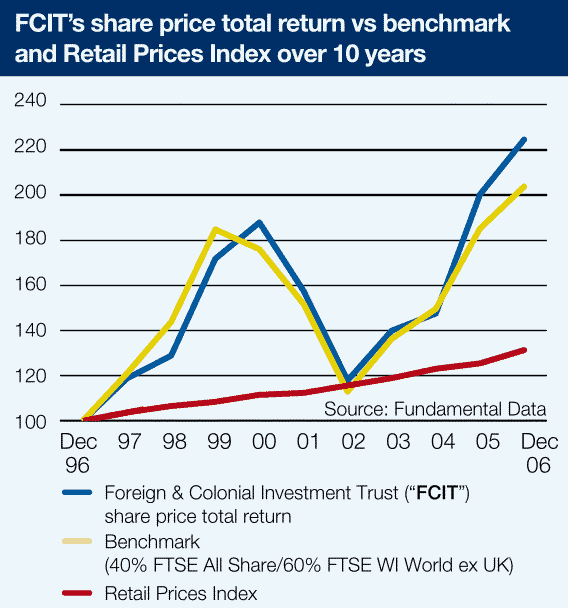
1998 17.2% share price discount to NAV
2006 11.4%
Initially looked to me as 'comparable', give or take price/NAV variations. I ran figures for both NAV and price based total returns and they both came out at 2.2 total return gain factors for 1997 to 2006 inclusive.
Why they benchmarked to 40/60 UK FT All Share and World excluding UK rather than just World alone ??? From
trustnet the more recent breakdown indicates just 9% UK weighting. A pure World tracker alone as a benchmark would IMO be the better comparison. I suspected perhaps the 40/60 choice was a form of sales pitch dressing, otherwise make the annual report data look more appealing, however when I ran MSCI World figures for 1997 - 2006 that came out at a 1.9 total return gain factor.
2008 and FCIT dropped -26% versus -17% for MSCI world (price based total returns)
2009 and FCIT gains +21% versus +16%
Compounding over those two years to -10% versus -4%
Generally seems like a reasonable 'tracker' after (relatively high) costs, but that does involve alpha/leverage (active management) to yield such, additional "risk" elements. And is also still a single stock risk factor. Many might be more comfortable going all-in with a large/major tracker fund provided by a large vendor than that of a single stock. FCIT has more recently been split off, former Canadian conservatives type management to a EU based entity, I believe to simplify otherwise increasingly more complex EU compliance requirements. Sometimes new entities buy-out assets with it in mind to yield better rewards for themselves than what the prior managers yielded.