Are there any (preferably free) data sources for obtaining total returns (TR) of a company over a minimum of 5 years? I use the Hargreaves Lansdown website (1) and Trustnet (2) already but these are limited to UK companies. I'm intersted in obtaining the TR for say Microsoft or L'Oreal ,for example.
(I realise that any total return graph would have to include share price and dividends in the currency of that country).
(1) https://www.hl.co.uk/funds/fund-discoun ... ion/charts
(2) https://www2.trustnet.com/Tools/Charting.aspx
Got a credit card? use our Credit Card & Finance Calculators
Thanks to Wasron,jfgw,Rhyd6,eyeball08,Wondergirly, for Donating to support the site
Source of Total Return info?
-
monabri
- Lemon Half
- Posts: 8427
- Joined: January 7th, 2017, 9:56 am
- Has thanked: 1549 times
- Been thanked: 3445 times
-
BullDog
- Lemon Quarter
- Posts: 2481
- Joined: November 18th, 2021, 11:57 am
- Has thanked: 2003 times
- Been thanked: 1211 times
Re: Source of Total Return info?
monabri wrote:Are there any (preferably free) data sources for obtaining total returns (TR) of a company over a minimum of 5 years? I use the Hargreaves Lansdown website (1) and Trustnet (2) already but these are limited to UK companies. I'm intersted in obtaining the TR for say Microsoft or L'Oreal ,for example.
(I realise that any total return graph would have to include share price and dividends in the currency of that country).
(1) https://www.hl.co.uk/funds/fund-discoun ... ion/charts
(2) https://www2.trustnet.com/Tools/Charting.aspx
How far back do you want to go? I just went to HL and selected both those stocks one after the other. If you select the blue text under the default performance graph (that goes back 10 years) that says "full interactive chart" I can select back to 1990 for Microsoft and it displays perfectly. I tried L'Oréal and it defaulted to as far back as January 1991. In both cases charting apparently perfectly to today. How far back you need, perhaps you can take a look. Hope that helps.
-
monabri
- Lemon Half
- Posts: 8427
- Joined: January 7th, 2017, 9:56 am
- Has thanked: 1549 times
- Been thanked: 3445 times
Re: Source of Total Return info?
BullDog wrote:monabri wrote:Are there any (preferably free) data sources for obtaining total returns (TR) of a company over a minimum of 5 years? I use the Hargreaves Lansdown website (1) and Trustnet (2) already but these are limited to UK companies. I'm intersted in obtaining the TR for say Microsoft or L'Oreal ,for example.
(I realise that any total return graph would have to include share price and dividends in the currency of that country).
(1) https://www.hl.co.uk/funds/fund-discoun ... ion/charts
(2) https://www2.trustnet.com/Tools/Charting.aspx
How far back do you want to go? I just went to HL and selected both those stocks one after the other. If you select the blue text under the default performance graph (that goes back 10 years) that says "full interactive chart" I can select back to 1990 for Microsoft and it displays perfectly. I tried L'Oréal and it defaulted to as far back as January 1991. In both cases charting apparently perfectly to today. How far back you need, perhaps you can take a look. Hope that helps.
hmmmm..... Interesting. Maybe I'm looking at the wrong part of the HL website. The link above for HL is limited to 5 year time window.
Any chance you could cut & paste the link?
TIA.
-
BullDog
- Lemon Quarter
- Posts: 2481
- Joined: November 18th, 2021, 11:57 am
- Has thanked: 2003 times
- Been thanked: 1211 times
Re: Source of Total Return info?
monabri wrote:BullDog wrote:monabri wrote:Are there any (preferably free) data sources for obtaining total returns (TR) of a company over a minimum of 5 years? I use the Hargreaves Lansdown website (1) and Trustnet (2) already but these are limited to UK companies. I'm intersted in obtaining the TR for say Microsoft or L'Oreal ,for example.
(I realise that any total return graph would have to include share price and dividends in the currency of that country).
(1) https://www.hl.co.uk/funds/fund-discoun ... ion/charts
(2) https://www2.trustnet.com/Tools/Charting.aspx
How far back do you want to go? I just went to HL and selected both those stocks one after the other. If you select the blue text under the default performance graph (that goes back 10 years) that says "full interactive chart" I can select back to 1990 for Microsoft and it displays perfectly. I tried L'Oréal and it defaulted to as far back as January 1991. In both cases charting apparently perfectly to today. How far back you need, perhaps you can take a look. Hope that helps.
hmmmm..... Interesting. Maybe I'm looking at the wrong part of the HL website. The link above for HL is limited to 5 year time window.
Any chance you could cut & paste the link?
TIA.
The link you posted, it goes to the funds selector. On the menu select shares rather than funds. Input Microsoft and you can select Microsoft. By the way, if you are using a tablet to view the website turn the tablet to landscape rather than portrait. The 5 years magically extends to 10 years.
-
BullDog
- Lemon Quarter
- Posts: 2481
- Joined: November 18th, 2021, 11:57 am
- Has thanked: 2003 times
- Been thanked: 1211 times
Re: Source of Total Return info?
This link is when I selected from today back to 1990. It works perfectly. You may have to view the page in landscape if using a tablet for the page to render correctly. Then select the desired "from" date.
https://www.hl.co.uk/shares/shares-sear ... are-charts
https://www.hl.co.uk/shares/shares-sear ... are-charts
-
monabri
- Lemon Half
- Posts: 8427
- Joined: January 7th, 2017, 9:56 am
- Has thanked: 1549 times
- Been thanked: 3445 times
Re: Source of Total Return info?
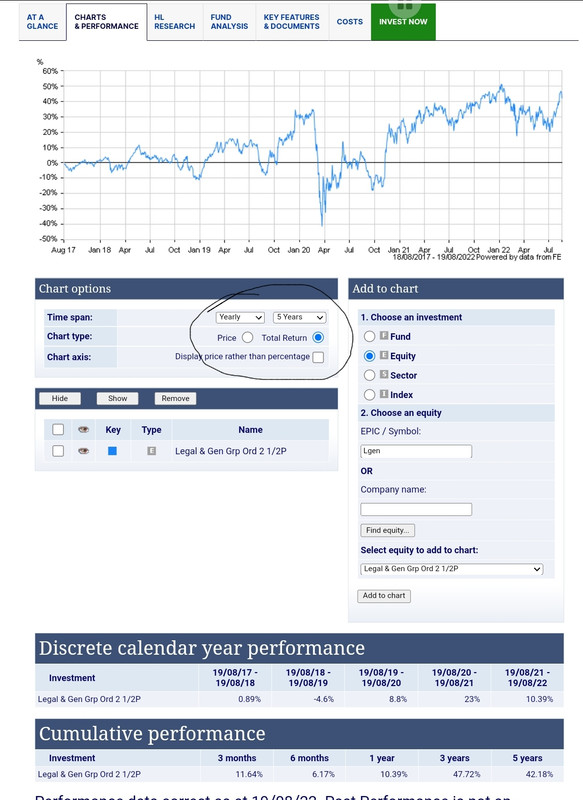
Ah, ok. I'm currently on a tablet and yes the orientation of the tablet gives rise to a 5 yr view of a 10 yr view ( horizontal) of shareprice. I'm trying to get the equivalent of this view ( UK share, LGEN chosen at random) but for "foreign" companies. The dividend payments for the US companies might be insignificant and perhaps shareprice is sufficient.
-
BullDog
- Lemon Quarter
- Posts: 2481
- Joined: November 18th, 2021, 11:57 am
- Has thanked: 2003 times
- Been thanked: 1211 times
Re: Source of Total Return info?
monabri wrote:Ah, ok. I'm currently on a tablet and yes the orientation of the tablet gives rise to a 5 yr view of a 10 yr view ( horizontal) of shareprice. I'm trying to get the equivalent of this view ( UK share, LGEN chosen at random) but for "foreign" companies. The dividend payments for the US companies might be insignificant and perhaps shareprice is sufficient.
Nope. Please click on my link above. That's showing a different page than the one I linked to. I have no idea how to share a screen image from my Android tablet I'm afraid.
Try - 1 Click on my link, the charts and performance tab for Microsoft should open. 2 Turn your tablet to landscape. 3 Click on the tab that says charts and performance. 4 Select from a date in 1990 to today. 5 Click update.
The chart shows Microsoft stock from 1990 to today.
PS I think the problem you are having is that you are selecting a fund then adding a company, then removing the fund. You must start off by selecting a share not a fund. Hope that helps a bit more.
-
BullDog
- Lemon Quarter
- Posts: 2481
- Joined: November 18th, 2021, 11:57 am
- Has thanked: 2003 times
- Been thanked: 1211 times
Re: Source of Total Return info?
OK hopefully this is a thumbnailed screenshot of the page at HL I linked to. Shows MS stock from 1990 to today. Just click the thumbnail for the full image -

-
monabri
- Lemon Half
- Posts: 8427
- Joined: January 7th, 2017, 9:56 am
- Has thanked: 1549 times
- Been thanked: 3445 times
Re: Source of Total Return info?
BullDog wrote:OK hopefully this is a thumbnailed screenshot of the page at HL I linked to. Shows MS stock from 1990 to today. Just click the thumbnail for the full image -
I can replicate the Microsoft shareprice graph ( as per your thumbnail picture). The plot I posted shows an example for LGEN on a total return basis over 5 years ( chart options - ringed).
Background:
I'm trying to compare total return on typical UK shares with shares that Terry Smith might select. Thus, I need to account for both shareprice movements and dividends received. UK shares typically paying highish dividend yields whereas Smith advocates companies which tend to reinvest rather than distribute to shareholders.
Here's the LGEN shareprice Plot over 5 years ( note the plot option, ringed in red).

The graph shows the effect of dividends removed from the return. The first plot for LGEN included them.
-
monabri
- Lemon Half
- Posts: 8427
- Joined: January 7th, 2017, 9:56 am
- Has thanked: 1549 times
- Been thanked: 3445 times
Re: Source of Total Return info?
plot 1 LGEN cumulative performance 42% , shareprice + dividends).
plot 2 LGEN cumulative performance 1% ( shareprice only).
plot 2 LGEN cumulative performance 1% ( shareprice only).
-
Arborbridge
- The full Lemon
- Posts: 10439
- Joined: November 4th, 2016, 9:33 am
- Has thanked: 3644 times
- Been thanked: 5272 times
Re: Source of Total Return info?
BullDog wrote:OK hopefully this is a thumbnailed screenshot of the page at HL I linked to. Shows MS stock from 1990 to today. Just click the thumbnail for the full image -
Isn't that just share price, not TR?
-
BobGe
- Lemon Slice
- Posts: 554
- Joined: November 5th, 2016, 12:49 am
- Has thanked: 176 times
- Been thanked: 125 times
Re: Source of Total Return info?
Arborbridge wrote:Isn't that just share price, not TR?
Yes, that would seem so.
It appears that the only way to get total return is to choose "Funds" and then Charts tab (which shows as FE data on HL, so same as doing it on Trustnet) and the limit appears to be 5 years. Doesn't work for US equities.
-
monabri
- Lemon Half
- Posts: 8427
- Joined: January 7th, 2017, 9:56 am
- Has thanked: 1549 times
- Been thanked: 3445 times
Re: Source of Total Return info?
BobGe wrote:Arborbridge wrote:Isn't that just share price, not TR?
Yes, that would seem so.
It appears that the only way to get total return is to choose "Funds" and then Charts tab (which shows as FE data on HL, so same as doing it on Trustnet) and the limit appears to be 5 years. Doesn't work for US equities.
It's looking like a "no " then.
I illustrated the potential significance of the dividend in terms of TR using LGEN as an example in my earlier posts.....1% on shareprice and 42% if dividends included over 5 years.
It probably won't make a big difference to assume share price return = total return for the US shares of interest ( generally very low or no dividend). It would have been nice to have readily been able to plot TR for a US versus a UK share.
-
Itsallaguess
- Lemon Half
- Posts: 9129
- Joined: November 4th, 2016, 1:16 pm
- Has thanked: 4140 times
- Been thanked: 10032 times
Re: Source of Total Return info?
monabri wrote:
The link above for HL is limited to 5 year time window.
One of the little known tricks available with the HL total-return charts is detailed below for anyone interested in getting round the 5-year limit -
1. Get your TR chart set up and configured as normal for a 5-year view
2. Right-click the chart area and select 'Copy Image Link' (or similar, depending on your browser..)
3. Open a new browser tab, and paste the above image URL from your clipboard into the address bar
4. Note in the image-link URL that there is a 'span' variable that sets the number of months that the TR chart is configured for. With the 5-year chart set earlier, it should say -

5. Change that span setting to the number of months you want the TR chart to show...
Here's an example chart for LGEN using the above technique to set the TR chart to a 10-year period, so the above span variable would be equal to 120 months -

Source - https://www.hl.co.uk/funds/fund-discounts,-prices--and--factsheets/search-results/v/vanguard-ftse-uk-equity-income-index-accumulation/charts
Usual caveats apply of course, with these types of non-documented features - offered up for interest only, not to be used for investment decision-making etc...
Hope it's useful...
Cheers,
Itsallaguess
-
monabri
- Lemon Half
- Posts: 8427
- Joined: January 7th, 2017, 9:56 am
- Has thanked: 1549 times
- Been thanked: 3445 times
Re: Source of Total Return info?
Thanks IAAG...I didn't know that trick with the HL plot window...if the data is available, I wonder why HL don't increase the plot timeframe from its current max? The HL plotting tool is something I use quite often when looking in the rear view mirror..however I recognise it's a bit like comparing past performance of say Man U and Man C...  past performance being no guide to the future...
Edit...I also tried setting the span to 240 months...it scraped the data...I couldn't verify if it was correct
Edit...I also tried setting the span to 240 months...it scraped the data...I couldn't verify if it was correct
-
Itsallaguess
- Lemon Half
- Posts: 9129
- Joined: November 4th, 2016, 1:16 pm
- Has thanked: 4140 times
- Been thanked: 10032 times
Re: Source of Total Return info?
monabri wrote:
If the data is available, I wonder why HL don't increase the plot timeframe from its current max?
I suspect it's down to a couple of conflating issues, one of which is that even on the currently-available one, three, or five-year setting, the charts will only draw correctly to those periods if there's underlying data available within those time-frames for all the requested investment entities listed at a given time...
We can see this issue if we open the default Fundsmith chart and set it to 5-years, and then add the Foresight Sustainable Forestry Investment Trust (FSF) to the chart.
As FSF is a relatively new IT, without the necessary underlying 5-year data behind it, the timespan for the chart will stay on the 5-year setting but the chart itself will only be dated back to November 2021, which clearly risks some confusion if these things aren't immediately apparent as to what's going on...
Secondly, we've then got the facility to add up to seven individual investment entities to that mix, which then perhaps escalates the risk of exposing this range-limitation to the lowest-denominator of those seven entities, and I think they've simply decided that exposing a 10-year range-option whilst carrying that initial date-range issue for such a large number of entities might be a step too far in terms of confidently delivering regularly robust results...
Cheers,
Itsallaguess
-
77ss
- Lemon Quarter
- Posts: 1276
- Joined: November 4th, 2016, 10:42 am
- Has thanked: 233 times
- Been thanked: 416 times
Re: Source of Total Return info?
Itsallaguess wrote:monabri wrote:
The link above for HL is limited to 5 year time window.
One of the little known tricks available with the HL total-return charts is detailed below for anyone interested in getting round the 5-year limit -
1. Get your TR chart set up and configured as normal for a 5-year view
2. Right-click the chart area and select 'Copy Image Link' (or similar, depending on your browser..)
3. Open a new browser tab, and paste the above image URL from your clipboard into the address bar
4. Note in the image-link URL that there is a 'span' variable that sets the number of months that the TR chart is configured for. With the 5-year chart set earlier, it should say -
5. Change that span setting to the number of months you want the TR chart to show...
Here's an example chart for LGEN using the above technique to set the TR chart to a 10-year period, so the above span variable would be equal to 120 months -
Source - https://www.hl.co.uk/funds/fund-discounts,-prices--and--factsheets/search-results/v/vanguard-ftse-uk-equity-income-index-accumulation/charts
Usual caveats apply of course, with these types of non-documented features - offered up for interest only, not to be used for investment decision-making etc...
Hope it's useful...
Cheers,
Itsallaguess
That's really good - thanks!
I've done a bit of playing around with this feature. I would guess that you already know this, but for the benefit of others:
If you want to see just the 10 year price change you can edit the link to alter
totalReturn=true to totalReturn=false
If you want to see a 10 year comparison of several companies, just construct the normal 5 year graph and copy and past the link as described.
etc.
-
mc2fool
- Lemon Half
- Posts: 7893
- Joined: November 4th, 2016, 11:24 am
- Has thanked: 7 times
- Been thanked: 3051 times
Re: Source of Total Return info?
Itsallaguess wrote:One of the little known tricks available with the HL total-return charts is detailed below for anyone interested in getting round the 5-year limit
:
:
FTSE 100 TR (blue) vs FTSE 250 TR (red) since 31/12/1985! (span setting is 100 years but that's as far back as it goes)
https://webfund6.financialexpress.net/clients/Hargreaves/chartbuilder.aspx?codes=NUKX,NMCX&color=0000ff,ff0000&hide=&span=1200&plotSingleAsPrice=false&totalReturn=true
-
MDW1954
- Lemon Quarter
- Posts: 2365
- Joined: November 4th, 2016, 8:46 pm
- Has thanked: 527 times
- Been thanked: 1013 times
Re: Source of Total Return info?
Itsallaguess wrote:
One of the little known tricks available with the HL total-return charts is detailed below for anyone interested in getting round the 5-year limit -
...
Itsallaguess
Superb! Brilliant. Thank you. Duly recc'd.
MDW1954
-
1nvest
- Lemon Quarter
- Posts: 4451
- Joined: May 31st, 2019, 7:55 pm
- Has thanked: 697 times
- Been thanked: 1370 times
Re: Source of Total Return info?
monabri wrote:Are there any (preferably free) data sources for obtaining total returns (TR) of a company over a minimum of 5 years? I use the Hargreaves Lansdown website (1) and Trustnet (2) already but these are limited to UK companies. I'm intersted in obtaining the TR for say Microsoft or L'Oreal ,for example.
(I realise that any total return graph would have to include share price and dividends in the currency of that country).
(1) https://www.hl.co.uk/funds/fund-discoun ... ion/charts
(2) https://www2.trustnet.com/Tools/Charting.aspx
The US have quite a number of UK ADR's
https://topforeignstocks.com/foreign-ad ... tish-adrs/
Drop your choices into PV and that might yield monthly/annual total returns, in US$. Use £/$ exchange rates from the FRED to convert those to £.
Basically ADR's are a US stock exchange listing of UK shares with prices and dividends in US$, so prices tend to closely align as otherwise there'd be arbitrage opportunities.
Who is online
Users browsing this forum: No registered users and 12 guests