If I go and look at the data for example, Finsbury Growth and Income IT (FGT), I see this:
https://www.ii.co.uk/investment-trusts/ ... rd/LSE:FGT
Scrolling down, there is a table comparing it with similar ITs, that give the Premium/Discount, Yield, %Increase up to 5 years etc.
Maybe a silly question for some, but could some kind soul tell me if the 5yr% figure is the increase in price only, or Total return with dividends reinvested? I assume the latter, but can't find any explanation on the site.
Many thanks,
Steve
Got a credit card? use our Credit Card & Finance Calculators
Thanks to eyeball08,Wondergirly,bofh,johnstevens77,Bhoddhisatva, for Donating to support the site
Reading the data on the ii website?
-
stevensfo
- Lemon Quarter
- Posts: 3485
- Joined: November 5th, 2016, 8:43 am
- Has thanked: 3867 times
- Been thanked: 1418 times
-
Dod101
- The full Lemon
- Posts: 16629
- Joined: October 10th, 2017, 11:33 am
- Has thanked: 4343 times
- Been thanked: 7535 times
Re: Reading the data on the ii website?
stevensfo wrote:If I go and look at the data for example, Finsbury Growth and Income IT (FGT), I see this:
https://www.ii.co.uk/investment-trusts/ ... rd/LSE:FGT
Scrolling down, there is a table comparing it with similar ITs, that give the Premium/Discount, Yield, %Increase up to 5 years etc.
Maybe a silly question for some, but could some kind soul tell me if the 5yr% figure is the increase in price only, or Total return with dividends reinvested? I assume the latter, but can't find any explanation on the site.
Many thanks,
Steve
My guess would be the opposite, that it is a reflection of share price only. They seem to be emphasising the share price all through the chart. Unless they have adapted the chart for ITs, then the usual way to display these would be the actual share price, say for the likes of Unilever. But I do not know and the only way to find out would be to ask II if it cannot be found on the site.
Dod
-
mc2fool
- Lemon Half
- Posts: 7886
- Joined: November 4th, 2016, 11:24 am
- Has thanked: 7 times
- Been thanked: 3043 times
Re: Reading the data on the ii website?
stevensfo wrote:Maybe a silly question for some, but could some kind soul tell me if the 5yr% figure is the increase in price only, or Total return with dividends reinvested? I assume the latter, but can't find any explanation on the site.
Comparing with https://www.theaic.co.uk/companydata/0P ... erformance it looks like the ii figure is TR.
(Note that the AIC figures are for the day before, which could explain the minor differences.)
-
Alaric
- Lemon Half
- Posts: 6061
- Joined: November 5th, 2016, 9:05 am
- Has thanked: 20 times
- Been thanked: 1413 times
Re: Reading the data on the ii website?
stevensfo wrote:Total return with dividends reinvested? I assume the latter, but can't find any explanation on the site.
More likely to be Total Return with dividends treated as withdrawn on their payment dates. Whilst OEICs and ETFs would calculate an accumulation unit price with notionally reinvested dividends, no similar calculation is readily available for ITs.
-
stevensfo
- Lemon Quarter
- Posts: 3485
- Joined: November 5th, 2016, 8:43 am
- Has thanked: 3867 times
- Been thanked: 1418 times
Re: Reading the data on the ii website?
Thanks guys. I finally bit the bullet and did something my teacher told me to do many, many years ago: some Maths! 
Using the 5 year chart for both FGT and Middlefield Canadian Income (MCT), it's pretty obvious that the 5-year increase given in the table lower down is much greater than the 5-year share price increase, and sort of matches the share price increase plus the five years of dividends. I chose MCT due to its high dividends that I've been collecting for the last eight years.
Steve
PS I could help noticing in the FGT table showing other ITs, that for all its fame, it doesn't seem as good as Law Debenture, which beats it both on dividends and TR. In any case, I hold both and am pretty much LTBH so I'll find something else to worry about.
-
Dod101
- The full Lemon
- Posts: 16629
- Joined: October 10th, 2017, 11:33 am
- Has thanked: 4343 times
- Been thanked: 7535 times
-
mc2fool
- Lemon Half
- Posts: 7886
- Joined: November 4th, 2016, 11:24 am
- Has thanked: 7 times
- Been thanked: 3043 times
Re: Reading the data on the ii website?
Alaric wrote:stevensfo wrote:Total return with dividends reinvested? I assume the latter, but can't find any explanation on the site.
More likely to be Total Return with dividends treated as withdrawn on their payment dates. Whilst OEICs and ETFs would calculate an accumulation unit price with notionally reinvested dividends, no similar calculation is readily available for ITs.
Sure there is. The AIC*, Morningstar* and Trustnet all have total-return-with-dividend-reinvested performance figures for ITs, and all of the ITs fact sheets and the like quote TR on that basis too.
https://www.theaic.co.uk/companydata/0P00000XEG/performance
https://tools.morningstar.co.uk/uk/cefreport/default.aspx?tab=1&Id=F0GBR053PE
https://www.trustnet.com/factsheets/t/fd89/finsbury-growth--income-trust-plc
* the AIC's figures are supplied by Morningstar
-
monabri
- Lemon Half
- Posts: 8418
- Joined: January 7th, 2017, 9:56 am
- Has thanked: 1548 times
- Been thanked: 3439 times
Re: Reading the data on the ii website?
The figures are total return.
Use the comparison tool at HL. Here's the 5 year FGT v LWDB comparison.
https://www.hl.co.uk/funds/fund-discoun ... ion/charts
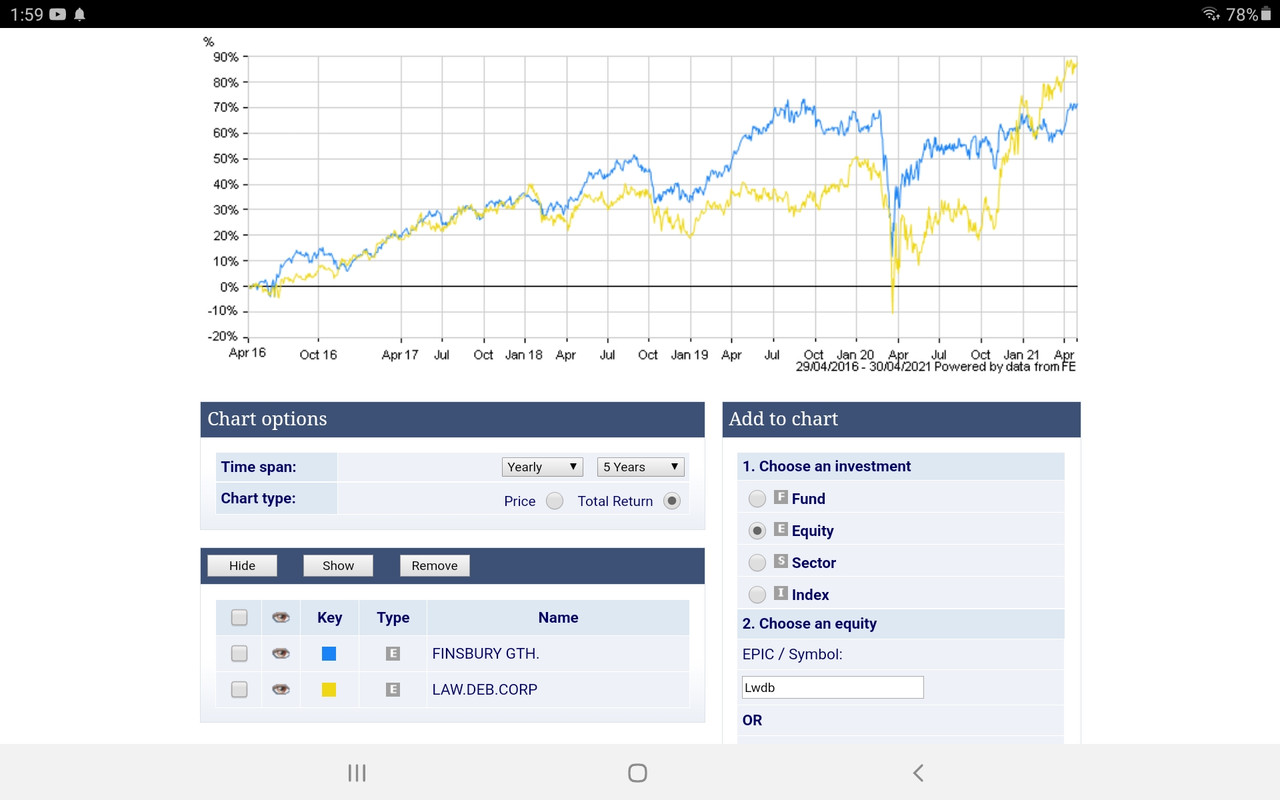
( there is an option to compare prices only by selecting the appropriate "radio" button).
Use the comparison tool at HL. Here's the 5 year FGT v LWDB comparison.
https://www.hl.co.uk/funds/fund-discoun ... ion/charts
( there is an option to compare prices only by selecting the appropriate "radio" button).
-
monabri
- Lemon Half
- Posts: 8418
- Joined: January 7th, 2017, 9:56 am
- Has thanked: 1548 times
- Been thanked: 3439 times
-
monabri
- Lemon Half
- Posts: 8418
- Joined: January 7th, 2017, 9:56 am
- Has thanked: 1548 times
- Been thanked: 3439 times
Re: Reading the data on the ii website?
Might as well include the Unilever figures whilst I'm here
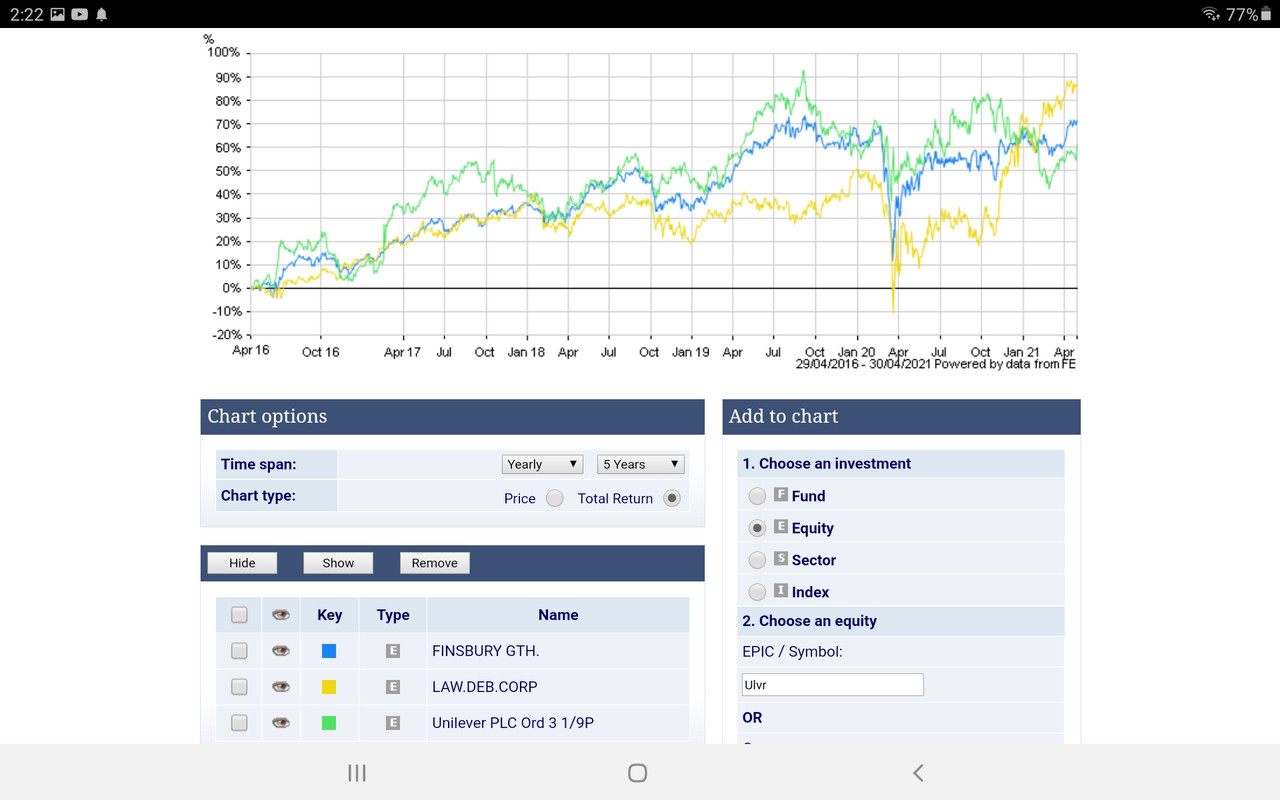
( select "equity", type in the ticker (eg ULVR) and "add" to the chart ( 7 curves max at a time).)
( select "equity", type in the ticker (eg ULVR) and "add" to the chart ( 7 curves max at a time).)
-
LittleDorrit
- Lemon Pip
- Posts: 94
- Joined: November 12th, 2016, 11:35 am
- Has thanked: 96 times
- Been thanked: 67 times
Re: Reading the data on the ii website?
Finsbury (FGT) has fo many years pursued a zero discount policy. By contrast the discount at Law Debenture (LWDB) has been comparaitively volatile.
Comparing the NAV total return figures for the two trusts over 5 years, one finds negligible difference in performance.
Not that these snapshots are always particuarly useful.
Law Debenture helpfully gives a comprehensive set of total return figures with each of it's daily NAV RNSs released on the LSE site.
-
doug2500
- Lemon Slice
- Posts: 664
- Joined: November 4th, 2016, 11:51 am
- Has thanked: 288 times
- Been thanked: 249 times
Re: Reading the data on the ii website?
That's really interesting thanks, Monabri.
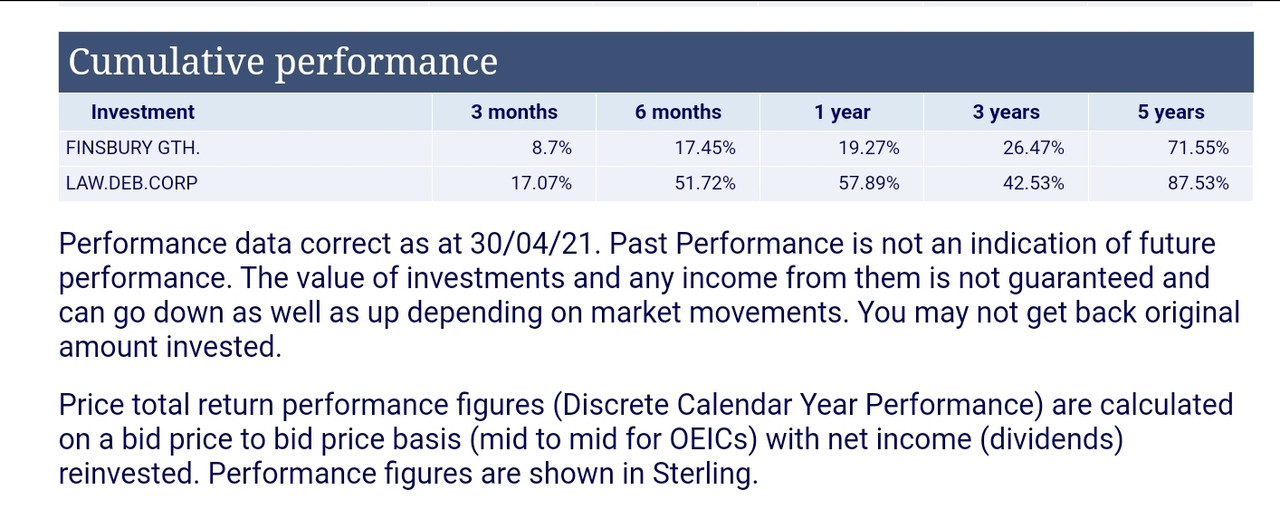
What I take away from it is how misleading a first glance can be - look at the cumulative performance and LWDB wins every time period indicating it's been outperforming for a while. Then when you look at the charts you can see that it's only it's outperformance in the last 4 months that's achieved this. Over most of the 5 years FGT has been ahead.
What I take away from it is how misleading a first glance can be - look at the cumulative performance and LWDB wins every time period indicating it's been outperforming for a while. Then when you look at the charts you can see that it's only it's outperformance in the last 4 months that's achieved this. Over most of the 5 years FGT has been ahead.
Return to “Investment Trusts and Unit Trusts”
Who is online
Users browsing this forum: Google [Bot] and 32 guests